
In this article we will discuss about the food chains, food webs and trophic levels of various organisms in the environment.
Food Chains, Food Webs and Trophic Levels:
1. Food Chain:
The transfer of food energy from the soured in plants through a series of organisms with repeated eating and being eaten, is called food chain (Fig. 48.2).

a. At each transfer about 80 to 90 per cent of the potential energy is lost. A small fraction of energy is lost due to the inability of the consumer to fully digest the food and absorb the nutrients, The major loss is to meet the metabolic requirements of the consumer.
ADVERTISEMENTS:
b. To minimise the loss, the number of steps or links in a sequence is limited, usually to four or five.
c. The shorter the chain, the greater is the available energy.
Food chains are of two basic types:
i. Living food chain:
ADVERTISEMENTS:
Starting from a base, viz., green plants, bacteria → micro- and macrophages herbivores → carnivores.
ii. Detritus food chain:
Dead bodies → microorganisms → detritus feeders → predators.
2. Food Web:
Food chains are not isolated sequences but interconnected with one another. A particular species may be eaten by a number of consumers and a consumer may eat a number of species. Food web is the trophic relationship among the species in an area. A food web usually consists of a number of food chains.
3. Trophic Level:
ADVERTISEMENTS:
In complex natural communities the numbers of steps involved in obtaining food from plants are considered as trophic level. The green plants—first trophic level; plant eaters—the second level; carnivores—the third level and the secondary carnivores— the fourth trophic level.
The food chain or the web of relations is a complex one. In an open woodland the producers are grasses, herbs and trees. Aphids feed on producers and are primary consumers. Birds feed on aphids or primary consumers and are secondary consumers. The hawks feed on the birds and are tertiary consumers.
In an aquatic environment diatoms are primary producers, crustaceans like cope- pods are primary consumers. Fishes are secondary consumers. Carnivorous fishes are tertiary consumers.
Energy Flow:
Living organisms utilize solar energy.
a. The radiant energy is transformed into chemical energy.
b. The chemical energy is transformed into mechanical and heat energy in cellular metabolism.
c. The solar flux is a constant and its value is 2 calories per square centimetre per minute (2 cal/cm2/min).
d. Plants absorb about 45% of the solar energy reaching an ecosystem, a part of which is lost as heat and the rest is used in photosynthesis.
Energy Fixation by Autotrophs:
This is best expressed by the equation of photosynthesis.
ADVERTISEMENTS:
6CO2 + 12H2O – 673 kilo cal./Chlorophyll – C6H12O6 + 6CO2 + 6H2O
Gross Primary Production:
The amount of carbohydrate synthesized by plants.
Net Primary Production:
Certain amount of carbohydrate produced is used in respiration of plants and the rest is net primary production.
Gross primary production – loss in respiration = net primary production.
Net Community Production:
A part of the net primary production is consumed by animals. The sum total of the part left is known as net community production.
Measurement of Primary producers:
A good number of techniques, viz., Harvest method, Oxygen and Carbon dioxide measurement, pH method, Radio-active method and, Disappearance of raw materials, have been developed to measure primary production, i.e., the amount and rate of energy fixation by autotrophs.
Energy Flow beyond Producer Level:
1. Energy flow is unidirectional, i.e., producer to consumer.
2. The loss of energy is about 80 to 90% in each step of energy transfer.
Fate of Energy beyond the Primary Consumers:
The herbivores are primary consumers. In a rough estimate the herbivores incorporate about 15 g cal/cm2/yr of energy. Of this they lose 4.5 g cal/cm/yr or 30% of energy due to metabolic activities. The rest 10.5 g cal/cm2/yr of energy is available to the carnivores. But the actual amount utilised is only 3 g cal/cm2/yr which passes to the carnivores.
In the carnivore level again, 60% of the energy is spent in metabolism and the rest 40% becomes part of the non-utilised sediments.
Pyramid of Biomass:
1. The interactions of the food chain phenomena and the size-metabolism relationship results in communities having a definite trophic structure, which is often characteristic of a particular type of ecosystem.
2. Trophic structure arid the trophic function may be shown graphically by means of ecological pyramids (Fig. 48.3), in which the first or the producer level forms the base, and the successive levels or the tiers make up the apex.

3. The pyramid of biomass is based on the total dry weight, caloric value, or other measure of the total amount of living materials.
4. In general, the biomass pyramid gives a rough picture of the overall effect of the food chain relationships for the ecological group as a whole
5. When the total weight of individuals at successive trophic levels is plotted, a gradually sloping pyramid may be expected as long as the size of the organisms dose not differ greatly.
Biogeochemical Cycle of the Ecosystem:
The elements, including all the essential elements of protoplasm, circulate in the biosphere in characteristic paths from environment to organisms and back to the environment. This is biogeochemical cycle. The elements and dissolved substances essential to life have been termed biogenic salts or nutrients.
These are divided into two groups. Macronutrients—carbon, hydrogen, oxygen, nitrogen, potassium, calcium, magnesium, sulphur and phosphorus, and Micronutrients—iron, manganese, copper, zinc, boron, sodium, molybdenum, chlorine and cobalt, The movements of nutrients are known as nutrient cycling.
Three major nutrient cycles have been identified:
Hydrologic Cycle:
Hydrological cycle (Fig. 48.4) is concerned with the movement of a compound, the water. Water is an agent of geologic change, eroding in one place and depositing in another. It distributes many chemicals including salts and dissolved gases. Water prevents great fluctuation of temperature and helps in metabolic activity of the organisms.
1. The cycle involves an interchange of components between the earth’s surface and the atmosphere via precipitation and evaporation.
2. The world precipitation is about 5.20 x 10²⁰g (geo-gram) annually. Of this about 1.08 x 10²⁰g falls on land surfaces, the remainder 4.12 x 10²⁰g on ocean surfaces. The distribution of particular types of ecosystems is dependent on precipitation and evaporation.
3. More water evaporates from ocean than that returns to it via rainfall and, conversely, less water evaporates from land and more -returns to it through rainfall.
4. That means a part of the rainfall which supports land ecosystem comes from the water evaporated from the ocean. In Mississippi valley as much as 90% of the rainfall comes from the ocean.
5. The amount of fresh water in ponds, lakes and rivers is about 0.25 geo-gram. The annual rainfall on land is 1.08 geo-gram and the run-off is 0.37 geo-gram per year. Thus the annual recharge rate of ground water is 1.08 – 0.37 = 0.71 geo-gram.
6. The circulation pattern of atmosphere determines the pattern of precipitation.

Gaseous Nutrient Cycle:
The atmosphere constitutes the major reservoir of elements that exist there in gaseous state. Carbon and nitrogen are chief constituents of the gaseous nutrient cycle.
Carbon Cycle:
The carbon cycle is simplest of all the nutrient cycles.
1. The cycling of carbon from atmosphere to producers → consumers → decomposers and back to atmosphere is known as carbon cycle (Fig. 48.5).

2. Ocean is the chief reservoir of carbon. It is stored as bicarbonate and the amount is fifty times greater than that in the air. This carbon regulates the amount of carbon in the atmosphere.
3. Atmosphere is the minor reservoir, but the basic movement occurs through it
4. The CO2 concentration in atmosphere ranges from 0.03 to 0.04 per cent.
5. The annual fixation of CO2 by green plants is about 4 to 9 x 10¹³ kg.
6. A considerable amount of biologically fixed carbon is returned to the atmosphere as gaseous CO2 through respiration of producers and consumers.
7. The decomposers return a greater amount through their respiration and processing of waste materials.
8. The interchange between atmospheric and aquatic carbon dioxide occurs through diffusion, the direction of flow governed by the concentration.
9. The aquatic phase occurs through precipitation.
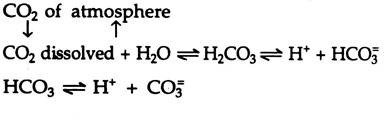
10. A litre of rain water contains about 0.3 ml CO2. The dissolved CO2 combines with the water of the ecosystem and forms carbonic acid, the reaction being always reversible.
11. The carbonic acid in its turn dissociates in a reversible reaction into H+ and HCO2 ions. The bicarbonate ions again dissociate reversibly into H+ and CO3 ions.
Nitrogen Cycle:
The movement of nitrogen from atmosphere to earth and back to the atmosphere is called nitrogen cycle (Fig. 48.6). It is a complete and perfect cycle.
1. The atmosphere contains about 79% nitrogen but most organisms are unable to use this nitrogen.
2. Nitrogen for the use of organisms comes from inorganic substances like ammonia, nitrite and nitrate and also in organic forms like urea, protein and nucleic acids.

Nitrogen fixation:
The nitrogen of the air is transformed into nitrates by. (A) electrification and photochemical means and (B) nitrogen fixing organisms, chiefly microorganisms.
A. The amount of nitrogen fixed by electrification and photochemical processes is about 35 mg/m2/yr.
B. The amount of nitrogen fixed by biological means is about 140-700 mg/m2/yr.
a. Nitrogen fixing bacteria:
i. Free living.
Examples: Azetobactor (aerobic), Clostridium (anaerobic).
ii. Symbiotic nodule bacteria on leguminous plants.
Example: Rhizobium.
iii. Purple bacteria.
Example: Rhodospirillum,
b. Blue green algae:
Examples: Anabaena, Nostoc.
c. Some lichens:
Nitrates and other simpler nitrogen compounds are used by plants for the synthesis of amino acid and protein, which, in turn, reach the animals.
Course of Events in Nitrogen Cycle Ammonification:
The protoplasm of dead animals and plants is acted upon by bacteria, actinomycetes and fungi, both on land and in water. While utilizing the organic nitrogen- rich materials, they convert those to and release the organic form, ammonia. The process is ammonification or mineralization. A good amount of ammonia is also gained from volcanic action.
Nitrification:
The process by which ammonia or ammonium salts are converted to nitrates is known as nitrification. It is slow, pH-dependent and occurs in acid condition.
The process has two steps—(a) The bacteria Nitromonous convert ammonia to nitrite (NO2) and (b) other bacteria, viz., Nitrobactor convert nitrite into nitrate (NO3). Some organisms can use nitrogen in ammonia, but the majority are incapable of doing this. Nitrate is the accessible form to them.
De-nitrification:
Release of nitrogen from nitrogenous compounds is de-nitrification. By the action of denitrifying bacteria Pseudomonas, Bacillus denitrificans. Mirococus, which can free the nitrogen, it enters the air as a gas and the nitrogen cycle is maintained.
The characteristic of nitrogen cycle is that the steps in conversion of protein to nitrates provide energy to the organisms which accomplish the breakdown. But the return steps from nitrite to protoplasm require energy from other sources, sunlight or organic matter.
Sedimentary Nutrient Cycle:
The lithosphere constitutes the major reservoir of the elements—phosphorus and sulphur. Phosphorus and sulphur play important role in the metabolism and growth of organisms. In the pathway of these essential nutrients short or long term stagnation occurs. Sedimentation in the oceans and deep continental lakes are most significant stagnation stages.
Phosphorus cycle:
The ratio of phosphorus to other elements in organisms is considerably greater than the ratio of phosphorus in the available and primary sources. Ecologically, phosphorus is very significant as it is the limiting or regulating element in productivity.
The phosphorus cycle is simple (Fig. 48.7).

Release of phosphorus:
1. The rocks or other deposits formed in geological ages are the reservoirs of phosphorus.
2. Phosphorus is released to the ecosystem with the erosion of the reservoirs.
3. Much of the released phosphorus reaches sea, where a part of it is deposited in the shallow sediments, and a part is lost in the deep sediments.
Return of phosphorus:
The return to the cycle is inadequate.
1. Sea birds bring back phosphorus through their ‘guano’ deposits.
2. Marine fish harvested by man is also a good source of phosphorus.
Plants take inorganic phosphate as orthophosphate ions. The phosphorus is transferred to consumers. After death, dissolved phosphate is released with the action of microorganisms, the decomposers. The excreta of animals also return phosphorus to the cycle.
Sulphur Cycle:
The reservoirs of sulphur are soil and sedimentary rocks. The atmosphere is a minor reservoir formed from fuel combustion.
1. The sulphur cycle (Fig. 48.8) is regulated by a group of specialized microorganisms, each carrying out a particular oxidation or reduction.
2. The sedimentary aspect of the cycle involves precipitation of sulphur in the presence of iron in anaerobic condition.
3. Ferrous sulphate is insoluble in neutral or alkaline water and as a result the sulphur has the potential for being bound up under these conditions to the limits of the amount of iron present.
4. The biologically incorporated sulphur is mineralized by bacteria and fungi in decomposition. Some such sulphur is also directly reduced to sulphides, including hydrogen sulphide, by bacteria.
The sulphur cycle is regulated by the interaction of geochemical, meteorological and biological processes. Inorganic sulphate SO4 is the source of elemental sulphur in the ecosystems. The sulphate is reduced to elemental sulphur or to hydrogen sulphide by anaerobic bacteria.
