
Read this term paper to learn about the system of monitoring animal diseases.
Term Paper # 1. Introduction to Animal Disease Monitoring:
Animal disease monitoring describes ongoing efforts directed at assessing the health and disease status of a given population. This activity necessitates a system for collecting, processing, and summarizing data (e.g., tabulation and graphical presentation) and disseminating information to appropriate agencies as well as individuals.
The term “disease surveillance” is used to describe a more active system and implies that some form of directed action will be taken if the data indicate a disease level above a certain threshold (e.g., surveillance systems for viral encephalitis’s).
In either case, the primary purpose of such systems is to provide data on the occurrence of disease, its geographic and temporal patterns, and, in some instances in veterinary medicine, on the effect of disease on productivity.
ADVERTISEMENTS:
Monitoring systems can also provide data to aid decision making regarding the effectiveness of health programs and practices, and for the planning of new ones such as the retrospective studies on brucellosis control or avian Newcastle disease control programs.
Disease monitoring can be conducted on many axes; for example, it may be concerned with one disease or a number of diseases, and the system may cover one species or many species of animals. Disease monitoring may be conducted primarily for the benefit of the animals themselves, or primarily as an early warning system for potential human health hazards.
Also, disease monitoring may be applied at different levels (e.g., regional, national, and international systems). In addition, data derived from herd health programs are closely related to disease surveillance systems operating at the farm level. The scope of most monitoring and surveillance systems reflects the nature of the disease(s) and requirements for its control.
Farm level surveillance systems emphasize those diseases that are, at least theoretically, controllable by the individual farm owner. They tend also to stress the impact of disease on productivity as this, together with humane considerations, provides the incentive for disease control.
ADVERTISEMENTS:
Regional, national, and international systems usually emphasize diseases not controllable by the individual without at least some collective organized approach. Sometimes producer organizations form such cooperatives to control disease; however, in most instances, government veterinary agencies are intimately involved in coordinating and/or directing the system.
Each defined group of users will have different needs for disease monitoring, and one group may use the same information differently than another.
For example, farmers and their veterinarians are likely to view the occurrence of a specific disease in their herd (e.g., cattle deaths due to salmonellosis) very differently than would a state veterinarian concerned with program (notifiable) diseases, or a public health veterinarian concerned with human health risks.
Hence, no single monitoring system currently exists to meet the needs of such a broad range of individuals, and perhaps it is naive to think that such systems will exist in the foreseeable future.
ADVERTISEMENTS:
What is important, however, is that a particular monitoring system must meet the needs of those directly concerned with it. Whether the information is valid for other purposes, or can be extrapolated to the general population, will have to be assessed system by system.
The most frequently cited specific uses of animal disease monitoring include:
1. Estimating disease frequency (i.e., relative to other conditions and/ or as actual incidence or prevalence rates). When sufficient data are available, seasonal, cyclical, and secular trends are searched for;
2. Certifying that disease is absent (e.g., to certify that an animal herd or region is free from a specific disease such as brucellosis in cattle or hip dysplasia in dogs). The presence of a disease could affect the value of the animal/herd and restrict movement either into or out of these areas;
3. The early detection of foreign and/or emerging diseases (e.g., early detection of Newcastle disease in poultry and African swine fever virus in hogs, or detecting a significant increase in the frequency of diseases such as influenza in poultry, encephalitis in horses, or bovine leukemia); and
4. The making of management decisions based on the above (e.g., diagnostic laboratories need to consider their role as in 1 to 3 above and obtain equipment and staff accordingly, biology companies can plan their production based on needs projected from current knowledge, and research organizations can allot monies based on clearly documented needs).
Before proceeding with a description of some existing systems, it is necessary to discuss various qualitative aspects of the data used in disease monitoring. Further discussions of this topic are available elsewhere.
Term Paper # 2. Data for Monitoring of Animal Diseases:
i. Availability and Validity of Data:
The availability and validity of data are of primary concern when using field data for disease monitoring. The collection of accurate and representative field data (i.e., active monitoring or surveillance) is expensive, and few systems designed solely for this purpose exist. To minimize the costs of operating ongoing disease monitoring systems, data on disease occurrence that is being recorded for another purpose is very often used (i.e., passive monitoring).
The validity of the data for this secondary purpose requires careful evaluation. Although the data may be sufficiently accurate and complete for the intended primary purpose, they may be misleading if used for other purposes.
ADVERTISEMENTS:
Each monitoring system should tailor its principal objectives to its users, bearing in mind the political, social, economic, and cultural constraints of the area. As minimal criteria, the data must enumerate the occurrences of specific diseases and specify the time, location, and host characteristics of affected animals and of the population at risk.
When possible, ancillary data on the biologic and/or economic impact of disease will prove useful in assigning priorities to disease control and will enable the decision makers (politicians, administrators, veterinary officials, and herd owners) to deal more effectively with the disease situation.
ii. Specifying the Disease:
Special attention needs to be given to defining what constitutes a case. Should only instances of clinical disease be included, or are subclinical cases to be counted as well? Is the isolation of the putative pathogen (e.g., salmonella) from a carrier enough to lead to an incident that will be recorded? What if the isolation is made from environmental samples, feed, or an intermediary host (e.g., bluetongue virus in an insect)? Does a positive seroreactor qualify as a case? Such decisions have to be made early by those planning the monitoring system and/or by those planning to use secondary data for the purpose of monitoring during the period of interest.
New problems can arise if administrative and/or diagnostic changes are made. It should therefore be emphasized that rigorous definitions and procedures are needed to ensure valid compilations within the individual monitoring system.
Where possible, it is advantageous if these definitions allow meaningful comparisons among different systems. However, starting a system with sufficiently restricted objectives and achievable goals is probably more important than designing a broadly useful system with goals that are ill defined and/or achievable only in the long term.
Another requirement for implementing an effective monitoring system is a standardized nomenclature containing a unique definition for each of the diseases (cases) involved. The reason for this is obvious when one considers that very often disease monitoring systems involve the pooling of data from several participating institutions (e.g., laboratories, abattoirs, or veterinary practices), each of which may have several diagnosticians.
Although this may seem like a fairly simple requirement, experience has shown that it is very difficult to achieve. In most systems a unique numeric or alphabetical code is assigned to each member of a list of standard diagnoses. For example, the Standard Nomenclature of Veterinary Diseases and Operations (SNVDO) was the basis for the Veterinary Medical Data Program involving a number of colleges in North America.
Although this results in the use of standard terms, it does not ensure that different people use the same code for similar disease problems, nor does it protect against the same code being used for different problems by different people. In monitoring systems with limited scope, such problems may be quite easily overcome using ad hoc definitions and common instructions. However in larger, more generalized, and extended systems great effort is required to circumvent these problems.
iii. Enumerating Disease Occurrence:
The primary objective of any monitoring system is to provide, under the prevailing circumstances, a reasonably accurate estimate of the frequency of disease(s), usually but not always in a definable population(s). Each system should therefore be carefully evaluated for possible factors that in one way or another can introduce quantitative biases in the estimate.
The main types of biasing factors include unrepresentative selection of cases, incomplete reporting, and poor sensitivity and specificity of the diagnostic procedures. The last two factors tend to result in an underestimate of the frequency of common disease problems, while the first factor may inflate the apparent occurrence of rare diseases.
The apparent frequency of disease may exceed or be lower than the true frequency, depending on the sensitivity and the specificity of the test. A discussion of these factors in the context of monitoring zoonoses in the United States has been published by Schnurrenberger and Hubbert (1980). Specific examples of fallacies from inferences based on biased (unrepresentative and/or incompletely reported) data are given by McCallon and Beal (1982).
Another basic consideration in enumerating disease occurrence is to decide whether incidence, prevalence, or both types of data will be collected. Finally, one should consider the most appropriate unit of concern. In some instances the animal is the most appropriate unit of concern; however in others, such as infectious disease control programs the primary need is to ascertain whether a herd or flock is infected.
iv. Temporal Aspects of Disease Occurrence:
The approximate time of disease acquisition is of considerable value for developing causal hypotheses and monitoring as part of disease control programs. Thus, incidence data are preferable to prevalence data (the latter are nevertheless often used, because they are easier and less expensive to obtain). For the same reason, frequent reporting (days or weeks) to those who require the information is preferable to infrequent reporting.
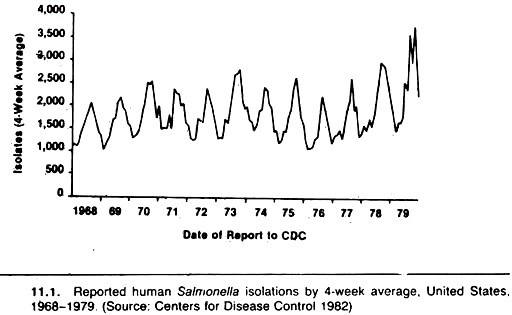
Seasonal distribution and secular trends in disease occurrence are often presented as updated graphs of the number of new cases versus calendar time, on the assumption the population at risk is relatively constant throughout the period. For example, yearly summaries of salmonella infections are based on the number of cases from which these organisms were isolated (Fig. 11.1).
A similar seasonal pattern is evident for Salmonella Dublin isolations in cattle herds in Denmark (Fig. 11.2). Although the total population at risk in these examples may not change dramatically over the course of 1 year, the consistent increase in number of isolations during the early fall period would be more suggestive of environmental influences if the number of cases (samples) cultured were used as a denominator.
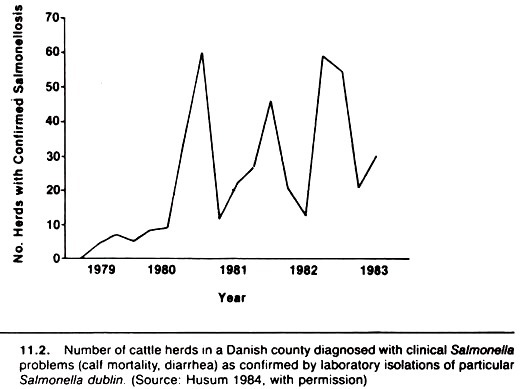
This would allow one to assess whether the proportion of samples submitted for culture that were found positive for salmonella changed seasonally, or if the seasonal pattern was merely due to more samples being cultured in the presence of a constant infection rate. Another example of the problem created by the lack of an appropriate denominator relates to the monitoring of hog cholera during the latter years of the eradication scheme in the United States.
In this instance, the total number of confirmed cases of hog cholera was found to be a poor indicator of progress in that it reflected the amount of program activity as well as the level of infection.
By expressing the confirmed cases as a ratio to the total number of suspicious cases, a much more useful measure was obtained; this ratio correlated closely with the prevalence of hog cholera in slaughtered swine. Thus, whenever possible, the true population at risk or an appropriate surrogate denominator should be used, and the actual rates tabulated or plotted versus calendar time.
It should also be appreciated that a downward time trend in disease occurrence during the course of a control program cannot be taken to prove a causal effect of the program per se, although it may suggest a causal hypothesis that might be tested using proper analytic investigations.
Because of the numerous changes in the environment and populations that take place over time, it is generally impossible to attribute an observed change in disease occurrence over time to one particular factor such as a control program. This would be similar to using “historical controls” in an experiment or analytic study, a practice that is not recommended.
For example, the observed attack rate of rinderpest in cattle in Great Britain during the 1860s has been used to justify the utility of predictive models (e.g., an early version of the Reed-Frost model) developed by William Farr. In this particular case, the downtrend in disease occurrence was predicted based on the observed number of cases, although the predicted decline was faster than the actual decrease in cases.
Similar data have been used to demonstrate the impact of the Cattle Diseases Prevention Act that included the power to quarantine and slaughter cattle and was put into effect in February 1866. (This act compelled the slaughter of infected animals and the disinfection of infected premises and allowed the slaughter of healthy in-contact cattle where deemed desirable.)
It is likely both reasons explain the disappearance of rinderpest and the success of the eradication campaign; however, the difficulty in establishing cause and effect based on one outbreak should be obvious.
A related, important temporal feature is that current data is usually of much more value than historical data. Thus, particularly in active surveillance systems, it is necessary to process the data in a timely fashion and distribute summaries to those who need to know as soon as possible thereafter.
During the 1982 outbreak of foot-and-mouth disease in Denmark, practitioners and others were regularly informed about the occurrence of new infections and the progress of the eradication efforts.
v. Location of Disease:
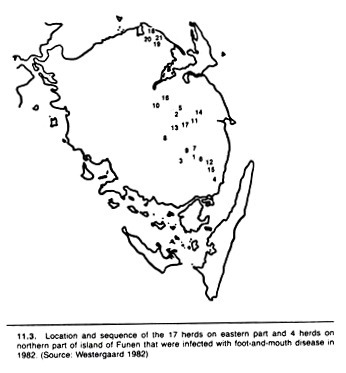
The data used in a monitoring system should contain sufficient detail to allow for a proper identification of the source of the animals in order to identify possible problem areas (herds, regions, etc.). Such data may be presented in the form of spot maps. Also, it is often advantageous to show changes in the geographic distribution of a disease with time (e.g., to illustrate the spread of the disease within a region).
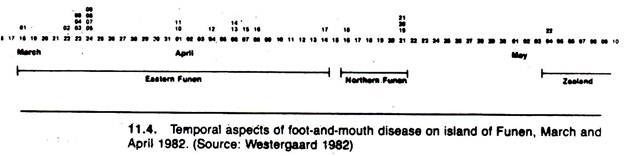
A spot map technique was used to portray the geographic distribution and movement of foot-and- mouth disease in Denmark in 1982 (Fig. 11.3). To an extent, valid interpretation of spot maps such as this demand some knowledge of the distribution of the population at risk. The actual temporal spread of infection is emphasized in the form of a histogram in Figure 11.4.
A major problem in locating diseased premises when monitoring at a central facility (e.g., from the slaughterhouse or marketplace) lies in tracing diseased animals to their herd of origin. In many instances, animal identification is not sufficiently advanced to allow easy trace-back to the herd of origin. This is particularly true when animals can be bought and sold many times in a short period and concomitantly moved over vast distances.
Recent studies on trace-back of tuberculosis-positive animals in the United States revealed that a majority of infected premises were in a different state than the slaughtering plant where tuberculosis was detected.
Similar findings were noted when attempts were made to trace back sheep infected with Echinococcus granulosus to their herd of origin. Animal identification systems are numerous but many are designed only to identify the animal within the herd. New developments in electronic and other identification systems may improve this situation.
vi. Characteristics of Diseased Animals:
Species, breed, age, and sex of the animals, if recorded, make it possible to further specify the epidemiologic pattern of disease occurrence and help in the identification of particular risk groups. Such data may, however be difficult to obtain on a routine basis. In most slaughtering houses, it is not possible to accurately state the age of a particular animal, only to identify it as being mature or immature.
If differences in disease rates between farms, counties, or slaughterhouses might be attributable to differences in the composition of the underlying populations with respect to host characteristics, such rates should be calculated as host-factor-specific, or they should be standardized for any differences in the distribution of host characteristics between the units of concern.
vii. The At-Risk Population:
Basic information about the population at risk is important to any disease monitoring system. In herd-level systems this information usually is readily available, whereas at higher levels (e.g., provincial or national), its availability is more limited. In certain areas and countries, animal censuses are carried out at regular intervals.
This information may be quite useful for general purposes; however, there are many situations where the data are not published in sufficient detail to make it suitable for disease monitoring purposes. The main problem is that, compared to the needs of the epidemiologist, the published statistics are rather crudely summarized (e.g., by year, geographical locality, species, age, or breed), but not by combined factors.
It is generally difficult to find accurate data on populations of nonfarm animals (i.e., companion animals and wildlife species). Census information is rare, but estimates may be based on insurance figures, questionnaire samples taken by industry (e.g., pet food manufacturers), vaccination sales figures, kennel club statistics, etc.
An interesting method for estimating the canine population of an area is by counting dog scats. However, all of these likely have various biases and should be used with caution. Formal sampling and/or a census often are the best procedures to accurately define the population at risk. Certainly, monitoring systems providing only numerator data are of less value than those also providing suitable population-at-risk data.
Term Paper # 3. Monitoring Production Data:
Monitoring production in relation to health and disease in farm animals is usually done on a within-herd basis, although there is a need for herd-level data.
Dairy Herd Improvement Association (DHIA) type systems may yield the data needed by providing the sampling frame for a survey or an analytic or experimental study. Production recording schemes are currently undergoing extensive modifications to improve (reduce) the reporting time and also to incorporate data on selected diseases.
As these systems become widespread and as the validity and comprehensiveness of the data included in them increase, they will provide an extremely useful data base for animal disease monitoring. In addition, it will be feasible to identify interrelationships between diseases, between genetic make-up and disease, and the association between disease and level of productivity.
A. Monitoring Based on Incidence Data:
Direct recording of new disease incidents as they occur in a population may require a significant effort, as in the case of continuous on-farm monitoring of common disease problems. Nonetheless, provided the benefits outweigh the costs, the farmer is quite likely to ensure completeness and accuracy of the data.
For selected disease problems, alternative sources of data may exist (e.g., when the disease is reportable to the veterinary authorities, or when diagnostic and/or therapeutic procedures require special assistance from veterinary hospitals or diagnostic laboratories).
Records kept by these specialist institutions may then be used for estimating the occurrence of the disease as described in the following sections:
i. Disease Recording at Farm Level:
The health-and-disease status of production animals is continuously monitored as part of the routine farm management practices, although the level of recording of disease incidents may vary greatly within and among different categories of herds.
In most traditional farm management systems, disease events, if recorded, are noted on the individual cow or sow card. This system provides an adequate recording basis for most decisions about individuals, but it is not well suited for monitoring the disease situation in the population (e.g., the herd).
Abstracting such primary records is a tedious task, usually only performed in special situations (e.g., in the case of a retrospective evaluation of a developing disease problem in need of documentation or a retrospective analytic study).
Farmers and/or their veterinarians rarely prepare formal herd summaries because of this. Systems for abstracting and summarizing these data are urgently needed, and it is important that computer software be more powerful than merely extending the individual animal card. Lack of conscientious recording may result in underestimation of some diseases and overestimation of others.
In many current so-called herd health programs the emphasis is on reproductive tract health; hence, not surprisingly, diseases of the reproductive tract predominate.
Some workers have indicated that data from such systems reflect self-fulfilling prophecies, and that this emphasis on reproductive disease is misdirected; other syndromes such as metabolic diseases may be more important production limiters. Also, lay reporting of conditions limits the specificity of the diagnosis, although in initial investigations centering on common clinical entities this drawback may not be serious.
In modern industrialized animal-production units systematic recording of health and production related events is a necessity if the farm manager (the decision maker) is to have up-to-date, overall knowledge about the state of affairs in the animals contained in all sections of the unit.
Computerized herd health and production monitoring systems may simplify disease monitoring by including disease episodes among the events continuously recorded as part of the system input. This will make it possible to simultaneously update the individual animal record as well as the herd’s disease-and-production status.
Gould (1975) provides one overview of the uses of monitoring disease incidence within a dairy herd. It is also important to reemphasize that disease incidents recorded at the herd level can have important applications outside the farm.
In a few countries (e.g., Norway) national production recording systems have recently been expanded to include disease events recorded by the herdsman and the veterinarian on the individual animal’s card between production recording visits. As mentioned, this is also true of the DHIA computerized recording scheme centered in Provo, Utah.
In the United States, authorities have for many years discussed the establishment of a national animal disease reporting system that could provide accurate and up-to-date information on the incidence of the more common and economically important diseases occurring nationwide. The current interest seems to focus on a model developed in Minnesota in the early 1970s.
The basic approach in this system is to collect information from a formally selected group of veterinarians and their clients; the major drawback is that since farmers use veterinarians to varying degrees and veterinarians often emphasize certain types of health problems more than others, it is not possible to extrapolate this information from the sample to the population.
Nonetheless, this basic model may evolve into a unique system based on a formal random sample of herds, in which herd owners, practicing veterinarians, and other officials will record selected disease data on a strictly defined routine schedule.
In most countries, however, only a few farms keep ongoing disease records (e.g., university or research institution farms where the ongoing research effort requires documentation). Table 11.1 is an example of the use of data from one such dairy herd where the incidence of left displaced abomasum (LDA) was found to increase dramatically between 1976 and 1978.
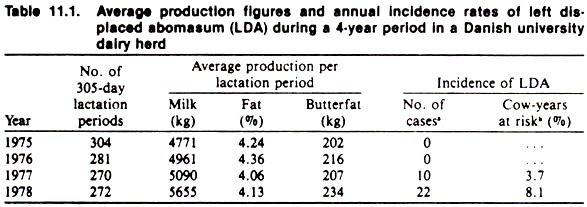
The data further indicate that this followed an increase in average milk yield as estimated from the DHIA system used for recording and monitoring of production data. Whether milk production per se is the causal factor or merely a surrogate measure of other factors (e.g., change in the ration) is unknown.
ii. Notifiable Disease Reporting:
For many years, veterinary authorities have operated specific monitoring systems for many contagious animal diseases by declaring them “notifiable” (i.e., reportable). The associated regulations require farmers and veterinarians to inform authorities upon suspicion of an outbreak; the officials then proceed with clinical, pathological, and other diagnostic investigations.
Laboratory tests are usually carried out to ensure a specific diagnosis, and control measures including tracing of contact and/or source herds are instituted following confirmation of the diagnosis. This approach has worked satisfactorily, especially with acute disease problems in well- established, intensive animal industries.
Many successful eradication programs carried out in the past have relied totally or partially on this principle, and notification continues to be an important tool in the constant watch for introduction of exotic diseases into susceptible animal populations. Here again, one must be careful in using data for secondary purposes even within the same program.
For example, those interested in detecting bovine brucellosis may test a number of “suspect herds,” but because these herds are not necessarily representative of all herds, the resulting laboratory data on prevalence of infection can be misleading. Those interested in controlling brucellosis once it has been detected will regularly re-bleed the herd and submit samples for testing.
The results of these samples are usually combined into an overall diagnostic laboratory report and hence can bias these data if used as estimates of frequency of infection. On the other hand, the prevalence of brucellosis at slaughter might be an excellent indication of the level of brucellosis in the population, but these results are of little value for detecting brucellosis without an appropriate trace back system.
Underreporting may occur with notifiable diseases depending on the nature of the particular disease. In Vermont, in the 8 months prior to February 1968, only one case of chorioptic mange was reported. Subsequently, based on a thorough examination of cattle, over 1100 confirmed cases were detected in 3 months after examining only 17% of that state’s cattle herds.
Hence, underreporting is likely to be a problem if the disease is not considered serious because of lack of information, nomadism (in developing countries), distrust of governmental authorities, lack of appreciation of common responsibility, and/or shortage of compensation funds.
A suggested way of improving reporting and overall compliance with disease prevention is to make the seller of an animal responsible for both on-site and off-site costs associated with selling an animal with a reportable disease. This would tend to make the marketplace a center for disease control rather than its spread.
iii. Routine Diagnostic Data:
In many veterinary practices, records of eases are kept in sufficient detail to serve as a basis for billing the client. If each diagnosis is recorded, compilation of cases may be used as a substitute for true incidence recordings.
Validity of the approximation depends on the proportion of cases in that area receiving veterinary care, and on the complete exclusion of prevalent cases (i.e., only new cases should be counted). (The latter is very difficult to achieve and hence data of this sort often reflect period prevalence more than incidence.)
Conversion to rates also requires estimates of the population at risk from which the cases originate. In the absence of such estimates, disease frequencies are sometimes expressed as proportional morbidity rates.
The denominator is not the true population at risk and may change independently of the numerator. Meaningful interpretation (e.g., of time trends) in proportional rates as indicators of similar changes in the corresponding incidence rates requires very rigorous assumptions about stability across time of several other factors, that influence the proportional distribution, and such assumptions are most often not justified.
In certain countries, all practicing veterinarians are required to report all diagnoses to a central office where countrywide statistics are compiled and published annually.
Knowing the population figures for the entire country enables estimates of overall incidence rates of all reported diagnoses. Problems with large-scale monitoring systems such as this include non-uniform use of nomenclature and diagnostic criteria, underreporting due to non-veterinary attended cases, and insufficient details on animal characteristics.
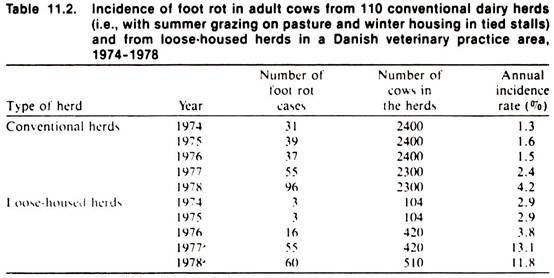
In Denmark, an accounting system for practitioners computerizes client records, including coding of the diagnosis and treatment of each case seen by the veterinarian. Recently, a study of foot rot in cattle was performed within a practice area to explore the possibility of using this source of information for epidemiologic purposes.
The results of this study contain some interesting information on the temporal distribution of the disease occurrence as shown in Table 11.2. To what extent the estimated incidence rates shown accurately describe the occurrence of the disease in the population is at best uncertain, and one might argue that, because of a variety of biases likely to have influenced the data, the results presented may not be reliable.
Another example of the use of farm level data for disease monitoring is the Quebec Animal Health Insurance Plan in Canada. This system pays a significant portion of the traveling and professional fees of large animal veterinarians in the province, the farmer being responsible for about 40% of the cost.
To collect his fee, the veterinarian must complete a multipart form that describes the demographic characteristics of the animals examined, the diagnoses, drugs used, and costs. This form is signed by the farmer before the veterinarian submits his bill to the government.
In the early years of the program (1972-74) only numerator data were available; however, data on the population at risk could easily be obtained and recorded to allow the calculation of meaningful rates. In Quebec, it is highly likely that the majority of clinical problems in domestic animals are seen by participating veterinarians, and thus the system provides a good overview of the magnitude of these problems.
Moving the locale for the monitoring of disease from the farm level to veterinary clinics, diagnostic laboratories, and referral hospitals can be a mixed blessing. It increases the validity of the diagnoses, but on the other hand it introduces a variety of possible selection biases, as well as often making the determination of the proper population at risk difficult.
The importance of these more specialized institutions to disease monitoring lies more in their ability to detect new and emerging disease problems than in their contribution to a balanced overview of the general disease situation.
In this regard, in Great Britain central computerized files of diagnoses made since 1975 at 34 Regional Veterinary Investigation Centers are maintained and used for annual reports and special retrievals in the Veterinary Investigation Diagnosis Analyses II system (VIDA II).
Apropos of the previous discussion, the summary tables in the annual reports carry the following warnings with regard to interpretation of the data:
1. The specimens received represent a biased sample of the field problems of animal disease. Great caution must therefore be shown extrapolating these diagnostic data. The figures represent only the material which is submitted from practicing veterinary surgeons.
They will not include those conditions which are easily diagnosed without recourse to a laboratory, and the number and type of submissions can be influenced by the economic climate. The statistics therefore do not bear any simple or direct relationship to the level of disease in the animal population.
2. Increases in the number of diagnoses for a condition may reflect a true increase in the number of incidents in the field, but may also be affected by such factors as increased awareness of a condition, or an improved diagnostic technique.
Apparent trends, especially upward trends should be related to total incidents which in most species have also shown an upward trend over the past. (Author’s note: this last statement relates to the proportional rate approach to describing relative frequency of disease.)
The unique feature of the VIDA II system is its list of conditions commonly accepted as “diagnoses.” They may not be full descriptions of the syndrome identified; in some cases the diagnosis describes both the pathological change and the causative organism (e.g., mastitis due to E. coli), in others it refers only to the isolation of the presumed causative organism (e.g., rotavirus infection), and in yet others it refers to the lesions observed in an imperfectly described syndrome (e.g., fatty liver and kidney syndrome in poultry).
The VIDA II diagnostic list currently extends to 399 diagnoses (cattle 101, pigs 72, sheep 96, birds 77, and miscellaneous 53) and it is in effect a written version of the verbal description commonly used by diagnostic officers and other pathologists. The diagnostic list is reviewed at regular intervals. No addition or other alteration is made until a steering group is satisfied that the new diagnosis represents a widely-recognized and reasonably well-defined entity.
iv. Special Surveys:
There are a variety of ways that special surveys can supply useful data. These include a range of surveys of members of a particular industry about disease problems.
Examples include interviewing people associated with the sheep industry, the collection of piglets to ascertain the extent of congenital lesions and mail surveys of producers to estimate cow-calf reproductive efficiency and neonatal survival efficiency. Special national disease surveys have been conducted in Great Britain and a summary of their results and comments on methodologic issues are available.
Other examples include special surveys to determine the cause of death in feedlot cattle. One such study based on postmortem examination of all dead cattle in a large feedlot confirmed previous suspicions and also validated the importance of some less frequent conditions such as atypical pneumonia.
A similar study was initiated as an integral part of a large field study of factors associated with morbidity and mortality in newly-arrived, stressed beef calves; summaries of these findings are available elsewhere. In the latter study, approximately 80% of all dead calves were examined by pathologists using a formal protocol, and the cause(s) of death was established on this basis.
However, during the first year of the study, farmers were hesitant to submit animals whose cause of death (e.g., accident or urolithiasis) was already known; thus the importance of these as causes of death was underestimated. A second problem is that the “cause of death” may not be a good indicator of the specific diseases that affect feedlot calves but only those diseases with a high case-fatality rate.
For example, lameness is a common disease of feedlot cattle, but it rarely is given as the cause of death although it could be of importance indirectly (i.e., lame cattle don’t eat and tend to develop pneumonia —the more direct cause of death —and die). Thus, the lesions (diseases) present at postmortem that are not thought to be immediately responsible for death may provide better insight into the types and levels of diseases in the feedlot.
Overall mortality rates and the incidence of certain fatal conditions also may be estimated where rendering plants (knackeries) are established. Outside of herd health systems, routine sources of mortality data in animals are very scarce, and although the disease conditions associated with the carcasses received at rendering plants are not routinely diagnosed, the total case load is often known and may in itself be of interest to monitor. For example, the annual crude mortality rate in mature cattle and heifers in Denmark has more than doubled during the years 1960 to 1980, and explanations for this are being sought.
Furthermore, random samples of the dead animals may be necropsied, and the resulting diagnoses used for monitoring purposes. Examination of wildlife found sick or dead can provide a valuable source of information on the occurrence, but not the rate, of certain transmissible diseases, including zoonoses and/or foreign diseases in an area.
As a final example of disease monitoring, a project designed to detect a disease in a specific population will be described. In such studies defined populations are followed over a period of years and the occurrence of disease and other untoward events recorded. This example, which is of particular interest to veterinarians, is the Animal Neoplasm Registry of Alameda and Contra Costa counties in California.
All neoplasms from these counties, whether of human or animal origin were studied in great detail and their occurrence related to the population at risk. This procedure is not only useful for monitoring per se, but the geographic distribution of the neoplasms may signal environmental hazards. It is also possible to study the zoonotic potential of these neoplasms (e.g., is feline leukemia associated with human leukemia?).
B. Monitoring Based on Prevalence Data:
One of the main difficulties in recording incidence data is the necessity of maintaining a continuous watch over the population at risk to identify the occurrence of each new case.
It is an easier task to investigate a population at a particular point in time and to record the prevailing cases. The information from prevalence studies may be considered a substitute for incidence data, or complementary to such data, depending on the circumstances and the disease in question.
Prevalence is a poor substitute for incidence if the disease either results in a high mortality or because of immediate treatment or spontaneous resolution diseased animals quickly and frequently recover. In using prevalence data, attention should also be given to possible changes in the mean duration of the disease as this change the relationship between prevalence and incidence.
For certain conditions a prevalence survey is, however, the only realistic possibility (e.g., in serological identification of subclinical infections) and can provide useful information about the level and distribution of infection in the population.
i. Screening for Disease:
A well-established procedure in regulatory medicine is Systematic diagnostic testing (screening) of animal populations for infectious diseases such as tuberculosis and brucellosis. Provided the sampling units are randomly selected, the number of affected herds (animals) out of all herds (animals) tested in any single screening survey will yield valid prevalence estimates.
In repeated national screening programs, identification of the proportion of newly infected herds (animals) may form the basis of national incidence estimates (see Table 11.3). However, if the testing is repeated on different samples of the population only prevalence estimates may be obtained directly. 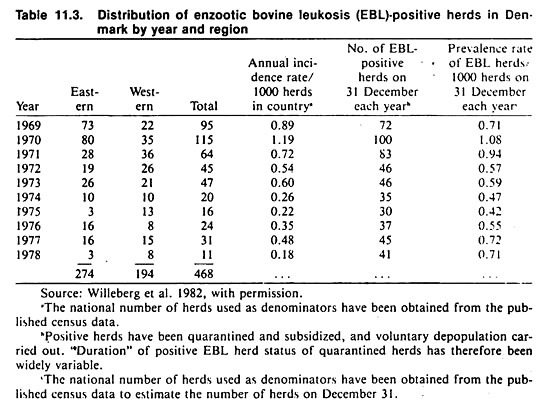
Indirect estimates of incidence rate per year (p) may be obtained using the following formula:
![]()
where p = 1 — q, and y is the age of the animal in years. This formula assumes a constant incidence rate in all ages, a susceptible population at birth, and little migration of animals or death/culling from the infection.
Special interest has been devoted to the development of tests applicable to animal products or by-products (milk, blood, tissue) that can be obtained at central destinations (e.g., creameries or sales yards) to avoid expensive and time consuming “down-the-road-testing.”
There are however, screening procedures (such as tuberculosis skin testing) for which no practical alternative methods exist. In national disease eradication campaigns (such as bovine tuberculosis eradication programs) when the frequency of disease becomes very low, the major effort shifts to case finding and away from monitoring per se.
This is sensible from the point of view of eradicating the disease and from the fact that it, to an extent, obviates the problems associated with low predictive values of tests under these circumstances.
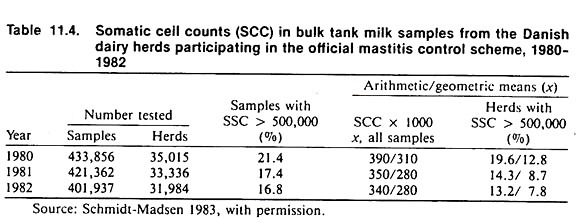
Testing of bulk milk samples for brucellosis (milk ring test) and mastitis (somatic cell counts and microbiological plating) still are extensively used in monitoring the prevalence of infectious diseases at the herd level (see Table 11.4).
A discussion of how repeated prevalence surveys can be used to estimate incidence (using mastitis as an example) is available. Innovative methods of monitoring populations (e.g., by culturing the milk filters used to filter milk as it is loaded from the bulk tank into the truck) are also being developed. One use of such methods is to monitor herds for organisms of potential zoonotic significance.
ii. Slaughterhouse Data:
The collection of blood serum at slaughter for diseases such as brucellosis, enzootic bovine leukemia virus infection, and pseudo-rabies has been widely used as a seroepidemiologic method of case-finding and monitoring. Of course, identification of the herd of origin of a positive animal is crucial to the successful trace back needed to implement the disease control function.
The pre- and postmortem inspection of animals at slaughter is in itself an extensive disease monitoring process. This monitoring might be performed by publicly employed veterinarians to assist in case-finding (e.g., of bovine tuberculosis), or to ensure the wholesomeness of animal products (meat, milk, etc.), or by private veterinarians to assess the extent of selected diseases (atrophic rhinitis, enzootic pneumonia) in their client’s animals.
The latter is useful to assist in identifying what diseases exist and their frequency, and as a means of monitoring the efficacy of changes in management and disease control (e.g., introduction of a vaccination program or modifying ventilation systems).
Most of the lesions found during routine slaughter inspection are chronic and, although they may be limited in their diagnostic specificity, the prevalent and persistent lesions recorded at slaughter can indicate economically important problems.
Many types of lesions that lead to total or partial condemnation are recorded mainly for monitoring purposes. It is well recognized that the extent of, and procedures used in, recording slaughter inspection findings may vary considerably from region to region and even among slaughterhouses within a region.
A major challenge to increase the value of the inspection process for disease monitoring, is to standardize these procedures and to describe lesions in a manner that will be informative to the animal owner and veterinarian.
The potential value of slaughterhouse inspection findings is great; unfortunately, however, those in charge of ensuring wholesomeness of food may function more or less independently of those in charge of publicly funded disease control, who in turn may function independently of the needs of the animal owner and the private practitioner. Rationalization of the overall process would go a long way toward increasing the value of this system.
As one example of a rationalized system, the Danish slaughterhouse monitoring system has, since 1979-1980, developed into a national pig herd health scheme. Problem herds are identified on the basis of data from computer files containing the monthly kill and the slaughter inspection findings in the form of standard codes for each individual swine herd in the country.
When retrieving a list of the potential problem herds, the data in the computer files are compiled, adjusted, and weighted according to possible confounding and biasing factors, such as the variation among slaughterhouses in mean rates of lesions and the size of the herd.
Joint herd visits to the problem herds by a local practitioner and the regional swine extension specialist are arranged, and they are expected to pay special attention to environmental and managerial factors that might be causally involved in the herd’s disease problems. This system provides a modern example of the close relationships among epidemiologic principles and methods, disease monitoring, and disease control.
iii. Serum Banks:
A special, “artificial” source of prevalence data is the so-called “serum bank” (i.e., a collection of frozen serum sample collected over a number of years from the populations of interest). The main objective of such banks is to provide a source for “retrospective monitoring” of the occurrence of seroreaction to disease agents, which subsequent to the time of sampling become of interest.
As an example of the utility of serum banks, it was possible to date, within one month, the first occurrences of the 1978 canine parvovirus pandemic. Retrospective studies of bovine leukemia virus infection have also been performed and recently reported.
C. International Monitoring:
Various monitoring systems at the local, regional, and national levels have been used to illustrate common concepts and features of disease monitoring systems. Monitoring of animal diseases also takes place at the international level.
The primary objective of international organizations involved in animal disease monitoring such as the International Office of Epizootics (OIE), the Food and Agriculture Organization (FAO), and the World Health Organization (WHO) of the United Nations is to promote the exchange of information on disease occurrence.
This can help in the prevention and control of animal diseases, facilitate international trade of animal products, improve and safeguard economies, increase protein supplies, and decrease human suffering in underdeveloped countries of the world.
These international organizations and their associated monitoring systems have primarily taken on functions as clearinghouses for the compilation and exchange of information about the animal disease situation in the participating countries (i.e., data from national disease monitoring systems).
One of the most visible efforts of the three organizations in this connection is their publication The Animal Health Yearbook, which contains up-to-date information on the occurrence and control of some important animal diseases around the world.
In this, as in other monitoring programs, a limiting feature of the compiled information is the basic validity and completeness of the source data —in this particular case the official disease information made available by governments of the individual countries. This information is supplemented by the recent publication of the Commonwealth Agricultural Bureau.