
Read this term paper to learn about the procedure and methods used for detecting subclinical disease in animals.
Term Paper Contents:
- Term Paper on the Process of Detecting Subclinical Disease in Animals
- Term Paper on the Sensitivity and Specificity in Animals
- Term Paper on the Indirect Estimates of Sensitivity and Specificity in Animals
- Term Paper on the Predictive Value of Screening Test Results
- Term Paper on the Methods for Improving Predictive Value
- Term Paper on the Accuracy and Precision
Term Paper # 1. Process of Detecting Subclinical Disease in Animals:
Screening is the application of a test to apparently healthy animals in order to detect infection or subclinical disease. In domestic animals, probably the major economic loss is due to the effects of hidden or subclinical disease.
ADVERTISEMENTS:
For example, subclinical mastitis is a mild in-apparent condition, yet because of its high prevalence, it has a much greater impact on the productivity of dairy herds than the sporadic yet dramatic clinical forms of the disease.
In addition, knowledge of the frequency and distribution of infectious and non-infectious agents of disease and of immune responses to these agents can greatly assist our understanding of disease processes and the importance of various agents in manifestation-ally classified syndromes such as pneumonia or gastroenteritis.
The frequency, distribution, and importance of subclinical disease may be very different from that of clinical cases. From an epidemiologic perspective, it may be argued that greater success at preventing disease occurrence can be realized if investigations are concentrated on how infections occur and persist in the absence of disease, rather than using only diseased animals as models of study.
Because the disease process is clinically in-apparent, special tests (e.g., the California mastitis test) are required to detect subclinical disease. Also, in addition to what one might consider conventional laboratory tests, epidemiologists include any device or process designed to detect or elicit a sign, substance, tissue change, or response as a test.
ADVERTISEMENTS:
Thus, examples of tests include common serologic and microbiologic tests for detecting agents or the animal’s response to an agent; clinical-pathologic tests designed to measure the number of particular cell types, the levels of tissue enzymes or minerals; as well as questions in personal or mail surveys. Using one or more of our senses during the diagnostic process for the detection of signs or tissue changes (including pregnancy diagnosis and meat inspection findings) could also be included as tests.
Tests are usually considered to be either pathognomonic or surrogate. Pathognomonic tests are those for which the detection of a sign, substance, response, or tissue change is an absolute predictor of the presence of the disease or disease agent. Surrogate tests detect secondary changes, which it is hoped will predict the presence or absence of disease or the disease agent.
For example, a positive culture of Brucella abortus from a cow’s milk sample is pathognomonic for brucella infection. Testing the milk for antibodies to Brucella abortus, however, is a surrogate test; since it is not measuring the presence of Brucella abortus per se, but rather the body’s reaction to brucella organisms or cross-reacting antigens.
Surrogate tests may produce false-positive results, whereas pathognomonic tests do not. Both types of tests can have false-negative results. Such false results and the question of assessing tests and interpreting the results lead to the subject of sensitivity and specificity.
ADVERTISEMENTS:
ADVERTISEMENTS:
Term Paper # 2. Sensitivity and Specificity in Animals:
Suppose it is possible to correctly classify animals into two categories—those having disease X and those not having disease X,— using a set of available tests. A new test has been developed, and its ability to differentiate between diseased and non-diseased animals needs to be evaluated. (Disease here is used in its broadest sense and includes subclinical disease and/or infection.)
The initial step in the evaluation is to select a sample of animals known to have disease X and a sample known not to have disease X. Although infrequently used in practice, formal random samples of each of these populations will help to ensure that animals to be tested are representative of diseased and non-diseased animals respectively, as this is crucial for accurate evaluation of the new test.
It is also important that the new test is biologically independent of the methods initially used to define the true health status of the animals. After appropriate animals are selected, they are tested and classified as being positive or negative on the basis of the new test results.
The resultant cross classification of n animals according to their true health status and the results of the screening test may be displayed as follows:
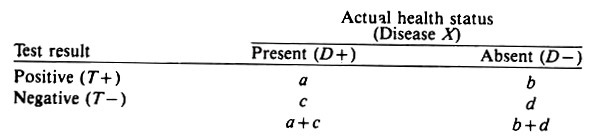
The sensitivity of the test is its ability to detect diseased animals and is defined as the proportion of the diseased animals that test positive, i.e., a/ (a -w c). The specificity of the test is its ability to detect non-diseased animals and is defined as the proportion of non-diseased animals that test negative, i.e., d/(b + d). (Non-diseased indicates animals that do not have the event of interest; it does not mean 100% healthy.)
In combination these two statistics describe how well a test can discriminate between non-diseased and diseased individuals. Note that the epidemiologic usage of “sensitivity” differs from immunologic or pharmacologic usage. In the latter disciplines, a sensitive test is one that detects a small amount of antibody, toxin, enzyme, etc.
An immunologically sensitive test may not be epidemiologically sensitive, so one should be careful not to confuse the different meanings. Sensitivity and specificity are calculated in the same manner as risk rates because they are probability statements.
ADVERTISEMENTS:
To summarize:
Sensitivity = a/(a + c) = p(T+/D+)
Specificity = d/(b + d) = p(T-/D-)
In a random sample of the overall population, the true prevalence proportion of disease in the population P(D + ) would be estimated by p(D + ), i.e., (a + c)/n. However, in practice this parameter is almost always unknown; only the test results (T+ and T-) are available, and hence the estimate of P(D + ) is the apparent prevalence proportion p(T+), namely, (a + b)/n.
Obviously, the true and apparent prevalence proportions are equal only if b = c. In general, b tends to be numerically greater than c and thus the apparent prevalence is usually somewhat higher than the actual prevalence, sometimes by a surprising amount.
To summarize, in a random sample of the population,
apparent prevalence = (a + b)/n = p(T+)
true prevalence = (a + c)/n = p(D + )
Note that for most surrogate tests there is an inverse relationship between sensitivity and specificity. That is, if the critical value of the test is altered so that the sensitivity is increased, the specificity will be automatically decreased. This is because the substances being measured may be present in non-diseased as well as diseased animals, although at different levels and with different frequencies, and often their distributions overlap.
For example, Figure 3.1 displays the distribution of antibody titers to agent X in a sample of healthy non-diseased (do not have agent X) and a sample of diseased (have agent X) animals. Note that most non-diseased animals do not have a titer to the agent, some have low titers and a very few have high titers.
On the other hand, in diseased animals the distribution is somewhat bell-shaped (i.e., a normal or Gaussian distribution). Very few diseased animals have low titers; most have moderate titers, and some have very high titers to the agent.
Although the diseased animals have higher titers on average, the two distributions of titers overlap, and this produces an inverse relationship between the sensitivity and the specificity of tests measuring this antibody response. The resultant sensitivity and specificity will depend on the critical titer selected.
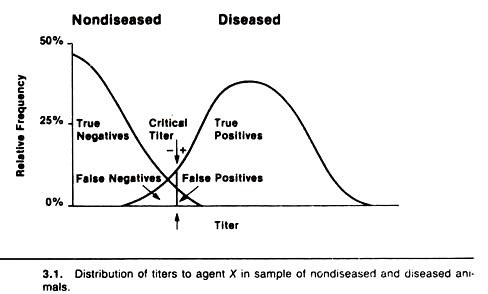
In practice, a critical titer is selected so that animals having titers above that point are considered positive and those having titers equal to or below that point are considered negative.
In terms of the previous 2 x 2 table, diseased animals with titers above the critical titer are the true positives, their number being represented by a; the non-diseased animals with litres below the critical titre are the true negatives, their number being represented by d; the non-diseased animals with titers above the critical titer are false positives, their number being represented by b, and the diseased animals with titers equal to or less than the critical titer are false negatives, their number being represented by c.
If the critical titer is adjusted to increase the sensitivity (i.e., lowered or moved to the left in Fig. 3.1), the number of false-positive animals will increase, hence this decreases the specificity.
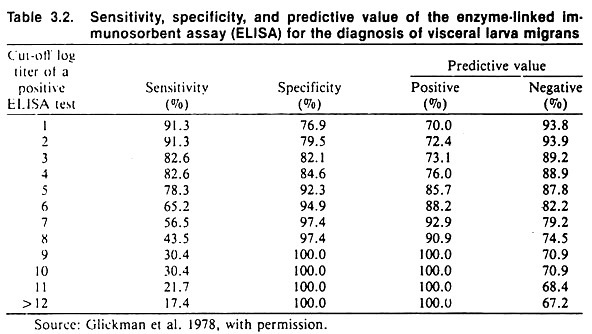
If the critical titer is altered by moving it to the right to increase the specificity, the sensitivity of the test will decrease, thus there will be a larger number of false negatives. An example of the effect of changing the critical titer when testing for visceral larva migrans using an ELISA test is shown in Table 3.2.
In general, sensitivity and specificity describe the discriminatory power of a test based on a single biologic sample taken at a point in time. They do not describe how well the test would function if applied very late in the disease process as compared to early in the disease process; nor do they describe how well one could classify the health status of animals based on results from using the test sequentially on the same animals.
The same principles apply, however, to the situation where acute and chronic (convalescent) titers are measured, and an animal is declared infected or diseased if there is say a two-fold or four-fold titer rise. Here the question of interest is the ability (i.e., sensitivity and specificity) of a specified increase in titer to discriminate between diseased and non-diseased animals.
Term Paper # 3. Indirect Estimates of Sensitivity and Specificity in Animals:
Sometimes the test to be evaluated is biologically similar to those available to diagnose the disease, yet estimates of sensitivity and specificity are desired. This is frequently the case with diseases of viral etiology where the virus is difficult to culture, and secondary binding tests are used to detect the presence of antibody to viral antigens.
In this instance, the results of the new test can be compared with the results of a bank of standard tests. For this purpose, animals positive to all tests in the bank are assumed to be diseased, and animals negative to all tests in the bank are considered disease-free. Animals with intermediate types of response are excluded from further analyses.
The sensitivity and specificity calculations proceed in the usual manner, but the results of the comparisons should be prefixed with “relative” to indicate that the determinations are based on biologically related tests. Usually the results obtained by this method represent maximum values of sensitivity and specificity.
The reader should note that comparing the results of one test to the results of a biologically related surrogate test does not allow the establishment of sensitivity or specificity. This procedure can establish which test gives more positive results and the extent of agreement between the tests, but not their ability to differentiate diseased from non-diseased animals.
In other situations, it may prove very difficult to assemble a sufficiently large representative group of non-diseased animals in order to determine the specificity of a test.
However, if test results on a relatively large number of representative animals (n > 1000) are available, and if it is reasonable to assume that the prevalence of disease is less than 1% and that the test has high sensitivity, an approximation may be used. The approximation is based on the assumptions that all test-positive individuals are false-positives and that disease is rare. Thus specificity can be estimated by 1 – (number of test positives)/n = 1 – (a + b)/n.
Example Calculations:
If 17 of 2000 representative animals have positive tests, then assuming all are false-positive reactions the minimum specificity would be 1 – 17/2000 = 0.9915 or 99.15%.
Under some circumstances, it may be possible to conduct a detailed follow-up on the test-positive animals and classify them into diseased and non-diseased (false-positive) groups.
In this case, assuming a reasonable sensitivity, specificity may be more accurately estimated by:
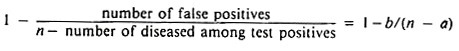
Finally, if estimates of sensitivity are available, the above estimate may be improved by using a* instead of a, where a* = a/sensitivity (a* estimates a + c).
Example Calculations:
If 12 of the above 17 reactors were found to be diseased, the minimum specificity would be 1 – 5/(2000 – 12) = 1 – 0.0025 = 0.9975 or 99.75%. In addition, if the test was known to be 80% sensitive, an improved estimate of specificity would be 1 – 5/(2000 – 15), which to four decimals in this case is also 0.9975 or 99.75%.
Term Paper # 4. Predictive Value of Screening Test Results:
The predictive value of a positive test is defined as the proportion of diseased animals among those that test positive; that is, the quantity p(D + /T+) which is calculated using a/(a + b). (Unless otherwise stated, this discussion will be restricted to the predictive value of a positive test result.)
Caution is required here because this quantity sounds and looks like p(T+/D +) (i.e., sensitivity), but it is quite different. Predictive value is important because it reflects the way test results are used in the field.
Here the question is, Given that an animal has a positive test, what is the likelihood that the animal has the disease or infection under study? This question arises because the true state of health is unknown, hence, the practitioner must argue backward from test results to the likelihood of disease, not from disease status to the likelihood of a specific test result.
The predictive value of a test has been used as a method of test selection. However, the predictive value of any given test is affected by both the sensitivity and the specificity of the test, as well as by the true prevalence of disease in the population.
Since the latter usually is unknown, it makes the selection of the “best” test difficult, because the direction of the inequality of predictive values of two tests can be reversed depending on the prevalence of disease. One cannot assume that the test with the highest predictive value is necessarily the most sensitive or specific.
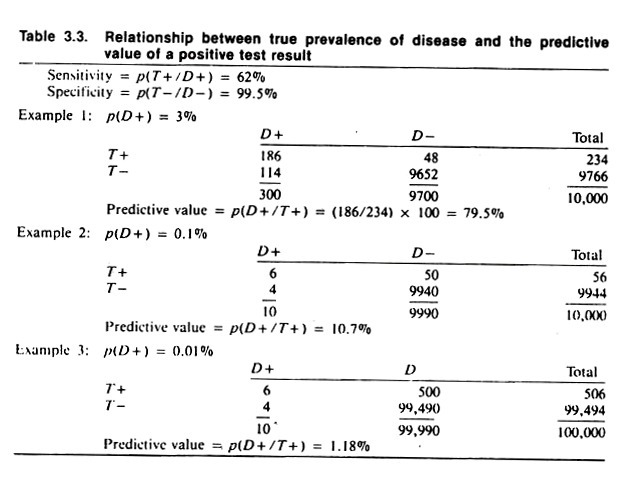
The data in Table 3.3 demonstrate the effect of prevalence of disease on the predictive value of the test result. Note that when the prevalence of disease is 3%, the predictive value of the test is 79.5%. (This is found by dividing 234, the number of test positives, into 186, the number of true positives.) When the prevalence of disease is 0.1% (i.e., one animal per thousand is diseased) the predictive value is 10.7%, and when the prevalence of disease is 0.01% (i.e., one animal per ten thousand) the predictive value of a positive test is 1.2%.
Note that the assumed level of sensitivity and specificity, 62% and 99.5% respectively, have not changed except for rounding to obtain whole numbers (animals).
The example in Table 3.2 which is based on testing for visceral larva migrans, illustrates the relationship between predictive value, sensitivity, and specificity; the prevalence of disease being constant. The predictive value of this test is quite good (being at least 70%). This is only true because of the high prevalence proportion of visceral larva migrans of 37%.
The predictive value of a positive test result in a variety of circumstances can be estimated using the formula:
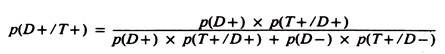
Although valuable from a theoretical viewpoint, since it explicitly describes the factors influencing predictive value, the true prevalence of disease is rarely known, and hence this formula is not often used in practice. Its major value is to demonstrate what the predictive value would be if the test was used at a specified prevalence proportion.
Since the prevalence proportion of disease is usually below 0.2, the lack of specificity in most screening tests is responsible for the apparent prevalence of disease often being somewhat higher than the true prevalence of disease. This may be verified by comparing the apparent and true prevalence of disease for the data presented in Table 3.3.
In general, the apparent prevalence is frequently not a good estimate of the true prevalence because of the false-negative and false-positive animals.
However, if the sensitivity and specificity are known, the true prevalence may be estimated by:
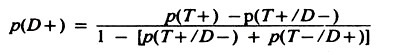
Note that p(T+/D-) = 1 – specificity, and p(T-/D+) = 1 – sensitivity.
For example, using the data in Table 3.3 example 2:
![]()
Term Paper # 5. Methods for Improving Predictive Value:
One method of improving the predictive value of a screening test is to screen only high risk populations; that is, populations likely to have a high rate of infection or disease.
Observational studies (e.g., cross-sectional, cohort, and case-control) are used to identify subgroups with an elevated risk of infection or disease, and the screening program can then be concentrated on those individuals with a high risk, hence ensuring a relatively good predictive value.
A second method of improving the predictive value is to use more than one screening test. This may be done in several ways. The first example assumes that a relatively sensitive, inexpensive screening test is available for use on all animals in the population, and a more sensitive but expensive test is available for use on a limited number of individuals.
Table 3.4 contains the expected results given that the initial test (with a sensitivity of 95% and specificity of 99%) is used on all individuals in the population, and the second test (with a sensitivity of 98% and specificity of 99%) is subsequently applied to the animal’s positive to the first test.
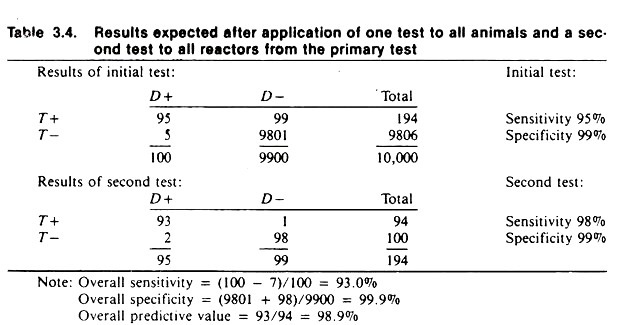
The overall results of using these two tests is a combined sensitivity of 93% and a specificity of 99.9%. Notice that 5 diseased animals were missed on the first test and in order to reduce the number of false positives from the first test, an additional 2 infected animals were declared negative on the second test.
However, the use of the second test reduced the number of false positives from 99 to 1. This demonstrates the general results to be expected utilizing tests in this manner. The actual results probably would not be this good, because if the two tests were biologically similar the results would be correlated; that is, they would tend to give similar results on samples from the same animal.
Another method of using multiple tests is to apply two or more tests simultaneously to all individuals. When tests are used in this manner, the resultant sensitivity and specificity are dependent on the way the results are interpreted.
One method of interpretation used when a high sensitivity is required is known as parallel interpretation. Using parallel interpretation, an animal is considered positive if it reacts positively to one or the other or both tests.
This increases the sensitivity but tends to decrease the specificity of the combined tests. This makes intuitive sense since it gives a diseased animal the greatest opportunity to react positively. The second method of interpretation used whenever a high specificity is required is known as series interpretation. In series interpretation, an animal must be positive to both of the tests to be considered positive.
As mentioned, this will increase specificity but decrease sensitivity because the likelihood of a diseased animal reacting positive to both tests is less than the likelihood of it reacting positive to both, or positive to the first and negative to the second or vice versa.
The outcome from using series and parallel interpretation with two tests is shown in Table 3.5. The sensitivity of the first test is 50% and its specificity 98.7%. The sensitivity of the second test is 60% and its specificity 98.6%. When the tests are interpreted in parallel, 150 of the 200 diseased animals are considered positive for a resultant sensitivity of 75%.
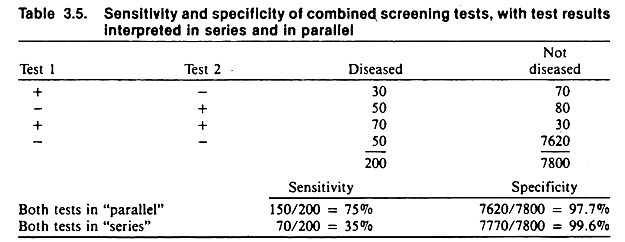
A total of 7620 of the non-diseased animals are considered negative and thus the specificity is 97.7%. When the results are interpreted in series, only 70 of the 200 diseased animals are considered positive for a resultant sensitivity of 35%. However, 7770 animals that are not diseased are considered to be negative for a specificity of 99.6%.
Obviously the above example could be expanded to include more than two tests and, again, the results would be similar to that indicated here — parallel interpretation increases sensitivity and series interpretation increases specificity.
In general, the greater number of tests involved, the greater the increase in sensitivity or specificity depending upon the method of interpretation. To identify the optimal classification (i.e., minimizing the overall misclassification rates) requires the use of more elaborate techniques such as discriminate analysis; however, these are beyond the scope of this book.
Term Paper # 6. Accuracy and Precision:
Unlike sensitivity and specificity, which relate to the discriminatory powers of a test to differentiate healthy and diseased individuals, accuracy and precision relate more to quality control within the laboratory. Obviously if a test is inaccurate and lacks precision, the results will certainly influence the sensitivity and specificity of the test.
However, for ease of discussion, accuracy and precision will be treated independently of sensitivity and specificity.
An accurate test gives a true measure of the substance, lesion, or structure of concern (i.e., the number of white blood cells, the level of blood sugar, the level of lead in blood, the size of follicles on ovaries). On the other hand, precision is the ability of the test to give a consistent measure upon repeated testing of the same sample. Each test will have its own inherent level of accuracy and precision.
Within limitations, accuracy is less important than precision in terms of screening tests. For example, if the extent to which a test tends to overestimate or underestimate the true level of the substance being measured is known, a correction for this may be made. When tests are not precise, more than one measurement should be made, and the average of the set of measurements used instead of just one test result.
Both precision and accuracy of a test are influenced by the variability of the test itself, the variability of the person who performs the test, and the differences between laboratories.
This text is not concerned with how precision and accuracy of a test are evaluated. Nonetheless, a simple way of assessing the precision of a test performed by one person is to submit repeat samples in a blind manner and calculate the variability (variance) among results.
(A blind technique is also essential when comparing test results for agreement and/or sensitivity and specificity. That is, the person performing test B should not have knowledge of the results of test A; otherwise, serious bias can occur.) Often, when using complicated tests requiring standardization on a daily basis, such a procedure will indicate that within-day precision is acceptable but between-day precision is poor. Hence paired sera (acute and convalescent) from the same animal should be tested on the same day.
The results of a study of intra- and inter-individual variation (precision) in the interpretation of canine chest radiographs are shown in Table 3.6. The extent of agreement between the two radiologists was 74% and, on average, the radiologists agreed with their previous findings 82% of the time. 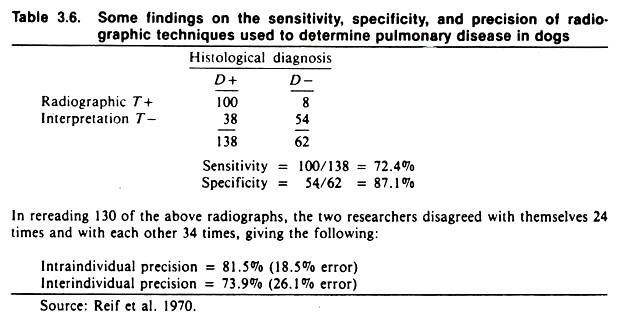
Note the average sensitivity and specificity of chest radiographs for detecting pulmonary disease, assuming histologic diagnosis to be correct. Given the low specificity of only 87%, radiography would not be an appropriate method of screening canine populations for respiratory disease if the true prevalence of disease was low. If used in this situation, the predictive value of positive radiographs would be extremely low.