
Read this article to learn about the measurement of disease frequency in animals with the help of calculations.
General Considerations of Disease Frequency:
Counts of individuals that are infected, diseased, or dead may be used to estimate workload, costs, or the size of facilities required to provide adequate health care for a specific animal population. However, epidemiologists usually wish to estimate the probability of events such as becoming infected, diseased, or dying in populations containing different numbers of individuals.
Hence they express these counts as a fraction of the number of animals biologically capable of experiencing the event. The latter group of animals is called the population at risk.
ADVERTISEMENTS:
Fractions having the general form a/(a + b) (where a is the number of animals with the event of interest, and b is the number of animals at risk of but not experiencing that event) are called either rates or proportions. In practical terms rates are fractions, but they usually are multiplied by 100 or 1000, etc., so the result is a number greater than 1.
Morbidity and mortality are the two main categories of events for which rates are calculated. However, there are other events of interest to veterinarians and their clients, including culling (the premature removal of animals from a herd or flock), survival to weaning, and pregnancy rate (the probability of becoming pregnant within a specified period). The format for calculating these rates is the same as for morbidity and mortality.
Rates – Specifying the Denominator and Time Components:
All rates have an external time component which refers to a period or a point in calendar time (called the study period). This should be specified when reporting results because the rate may change with time, from season to season, or year to year.
ADVERTISEMENTS:
In addition, a rate is based on an internal time component (ITC), a time period having a duration of less than or equal to the study period. An investigation of the rate of calf mortality might last for a period of three years, but the calculation of the rate could be based on a daily, monthly, yearly, or 3-year basis.
A basic rule in forming a rate is that each animal can only experience the event of interest once during a time period; they cease to be at risk after the event of interest occurs, and for the duration of the internal time period on which the rate is based.
Although mastitis can occur more than once during lactation, if one is calculating the rate of mastitis during lactation (ITC), only the first occurrence is counted. The easiest way to handle multiple occurrences is to shorten the ITC sufficiently to make the constraints reasonable. That is, several rates of mastitis, one for each 30-day interval postpartum, could be calculated.
In general, there are two different types of rates. The first, called a true rate (in technically precise terms, an incidence density rate), describes the average speed at which the event of interest (i.e., infection, disease occurrence, culling, death) occurs per unit of animal time at risk.
ADVERTISEMENTS:
In human medicine the most common time unit used for the period of risk is a year; however, shorter periods such as days or months are appropriate and often are used in veterinary medicine.
The concept of animal time may require elaboration; for example, one animal year of risk may result from one animal being at risk of the event of interest for one year, or 12 animals being at risk for one month (1/12 of a year), or 365 animals being at risk for one day (1/365 of a year). Many other combinations are possible, but the general rule is to multiply the number of animals by their average period at risk to obtain the animal time of risk.
If the data are available, an exact denominator for a true rate is formed by adding each individual time period at risk for all animals in the study. Often, calculating an exact denominator is not practical or necessary.
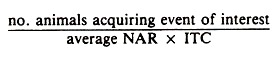
An approximate denominator may be formed by adding the number of animals at risk at the beginning of the time period to the number at risk at the end, dividing the sum by 2 to obtain the average number at risk (NAR), and multiplying the number at risk by the appropriate ITC.
Thus the general formula for a true rate is:
Example Calculations:
To illustrate this method of calculating a rate, assume that 3 animals were observed in a study period lasting 1 year.
During the year:
ADVERTISEMENTS:
2 develop a disease, 1 at day 120 (0.33 years) and 1 at day 240 (0.67 years).
The true rate of disease per animal year using the exact denominator is:
2/(1 + 0.33 + 0.67) = 2/2 = 1 per animal year
The true rate using the approximate denominator is:
2/{[(3 + 1)/2] x 1} = 2/2 = 1 per animal year
The two rates agree because the animals experiencing the event of interest were at risk for an average of exactly 1/2 year. Note that 2 animal years of risk were experienced by these 3 animals during the 1-year study period.
Also, the time period on which the rates were based (the ITC) is 1 year, the same as the period of study (the external time component). The ITC of 1 year is represented by x 1 in the above calculations. If the rate was desired on an animal week basis, the ITC factor x 52 would be used.
True rates are used when the animal population being studied is very dynamic (with additions and/or withdrawals) during the period representing the ITC. The approximate denominator is used when the exact period of risk of individual animals is unavailable or impractical to obtain.
True rates have a minimum value of zero and a maximum value of infinity; true rates apply only to populations and have no interpretation at the individual level. Had both animals developed disease on day 30 (0.08 of a year), the total animal years of risk would have been 1.16 and thus the rate would be 1.72 per animal year, or 172% (172 per 100 animal years). This cannot be sensibly interpreted at the individual animal level.
If a true rate has been calculated based on one internal time period, say x months, and it is desired to determine the rate on the basis of some other time period, say y months, then assuming a constant rate, the rate in the latter period is: true rate in y = true rate in x(y/x).
Example Calculations:
In the initial example, the true rate per animal month would be 1 x 1/12 = 0.08 per animal month.
The second type of rate, called a risk rate (in technically precise terms, a cumulative incidence rate), provides a direct estimate of the probability as defined in statistics of an animal experiencing the event of interest during the internal time period. (In this text, risk will be used as a synonym for probability and the specific measure of risk will be referred to as a risk rate. The words “at risk” may be used in their usual sense, namely, to denote animals susceptible to that disease.)
This method requires that each animal initially at risk be observed for the full duration of the stated time period or until the event of interest occurs. Also, there can be no additions to the number initially at risk. (These constraints are the major reasons that true rates often are used to describe the rapidity with which disease occurrence is changing in natural populations.)
If there are withdrawals (losses from the study), for reasons other than the event of interest, the effective denominator is determined by subtracting one half of the number withdrawn from the initial number at risk. (The reason for subtracting one half rather than some other number is more pertinent in biometrics courses.) Risk rates have a minimum value of 0 and a maximum value of 1; risk rates may be interpreted at either the population or individual level.
The general format for a risk rate is:
![]()
The risk (probability) form of rate is used whenever possible for analytic purposes (comparing rates statistically), since comparing true rates poses both practical and theoretical problems in terms of testing for statistical significance.
Example Calculations:
To illustrate the method for determining a risk rate (the probability of an animal developing disease during a time period of one year) using data from the previous example, is: 2/3 = 0.67.
The risk form of rate may be multiplied by 100 or 1000 to express it on a per 100 or 1000 animals basis. For example 67% means 67 events per 100 animals initially at risk.
If the risk form of rate has been calculated based on one internal time period (e.g., x months) and it is desired to express the risk rate for a different length of time (e.g., y months), then assuming a constant rate, the risk in the latter period is: risk rate y= 1 — (1 — risk rate in x)y/x.
Example Calculations:
If the risk rate of disease in one year is 0.67, the risk rate in two years is: 1 – (1 – 0.67)2 = 0.89.
If a true rate is available and the risk of an animal experiencing the event of interest (in the same time period) is required, the formula to convert a true rate to a risk rate is: risk rate = 1— e –true rate, where e is the base of natural logarithm. This approximation is extremely good when the true rate is below 0.05 per unit of animal time.
When rates are low (< 15%), the technical differences between true rates and the risk form of rates may be ignored primarily because the difference in magnitude between them is of little practical importance.
For example, in Table 3.1 the true rate of foot problems is 0.24 per cow year. Using the above formula, the risk rate per year is 0.21, for practical purposes, nearly the same magnitude. On the other hand, there is merit in noting the differences to avoid confusion when the rates are > 15%.

A practical method of calculating risk rates in dynamic populations circumventing the use of exponentials is:
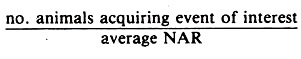
This formula is very much like the true rate formula given earlier, but in calculating the average NAR the animals developing the event of interest are not subtracted from the NAR at the end of the stated time period. For example, in Table 3.1 the risk rate of foot problems may be calculated using the average of 54 and 58 (46 + 12 cases) as the denominator; namely, 12/56 = 0.21.