In this article we will discuss about the study of animal diseases in regard to veterinary epidemiology.
Principles of Surveys and Data Collection:
All epidemiologic studies involve data collection, manipulation, and analysis. In general, the more organized these functions are, the easier the task will be. Also, appropriate data collection can improve the accuracy and precision of the data.
The nature of the study and the setting in which the data will be collected will influence the design and structure of the data recording form or questionnaire. At the very least, all studies require a well-planned data collection form. Simple forms will suffice if the investigator is collecting and recording data from only a few sources (such as medical history sheets) or for recording the results of field experiments.
More care and planning are required when the data to be collected are complex or the investigator is not in direct control of data (e.g., in a survey involving personal interviews or in a mailed questionnaire). For reasons described subsequently, the investigator may not wish to specify the actual objective of the study on the survey form; nonetheless objectives should be stated explicitly as part of the investigator’s plan of research.
Title of the Study:
ADVERTISEMENTS:
Appearing at the top of the survey form, the title should be clear and sufficiently detailed to inform collaborators of the general purpose of the survey. Consider the following two titles as examples: “Sow Survey” versus “Diseases of Sows During Pregnancy.” In most cases, the latter title would be preferred.
It is not necessary however to provide specific details in the title. In fact, sometimes it is desirable to keep the collaborators blind as to the exact purpose of the survey in order to prevent biased answers.
For example, questions in the survey might relate to a number of diseases as well as management or housing factors, although one syndrome (say metritis, mastitis, or agalactia) is the primary objective of the study. If the survey form is mailed to collaborators, a brief cover letter should be included.
Questions:
Frequently the most important step in solving a problem is knowing what question(s) to ask. Questions should be clearly worded, straightforward, and necessary. Initially, it is useful to list all of the factors about which information is required; then structure the questions so that the answer(s) to each question provides the appropriate data.
ADVERTISEMENTS:
If ventilation is of interest, the investigator must consider what specific information about ventilation is required. The presence or absence of fans would provide some information, the number and sizes of fans other information, and the method of controlling the fans still other information. At least one question would be required to obtain data on each of these dimensions that describe the ventilation.
Another useful approach to identify needed questions is to construct in advance the tables necessary to meet the study objectives, then cross-check these with the data that will be obtained from the recording form. This will help ensure that the appropriate questions are asked, and that all questions asked are required.
Often in preliminary studies where questions concern a broad range of factors (so-called “data snooping surveys”) it is useful to record in advance the interpretation to be placed on all of the associations that may be observed.
That is, should the number of fans be positively or negatively correlated with the rate of disease? Why? Should the rate of disease differ depending on whether automatic or manual switches are used to control the fans? If so, how should it differ? The rationale behind this exercise is the more questions asked the greater the likelihood of finding at least one factor significantly associated with the disease.
ADVERTISEMENTS:
Most associations between unrefined factors and disease are explainable after the fact; yet there must be some explanations that are, a priori, more sensible than others. For example, one might initially hypothesize an inverse relationship (a negative correlation or an odds ratio of less than one) between the presence of fans and the level of respiratory disease.
Presumably such a hypothesis relates to the maintenance of acceptable temperature and humidity levels, as well as the removal of dust and microorganisms from the air. However, suppose a positive association is observed. How does one interpret it? In general, it is preferable not to ignore observed associations, but associations running counter to the initial explanation should be viewed with some skepticism until they are validated.
Sequence of Questions:
Questions should be grouped according to subject matter or another logical basis such as the temporal relationship of events. This will help orient the collaborator’s mind to the task at hand.
General surveys might be structured on the basis of major factor categories such as housing, ‘ration, management, etc. On the other hand, if the survey is concerned with events related to the neonatal period or to the period after arrival in the herd, flock, or feedlot, sequencing the questions on a temporal basis might be more useful.
Format of the Record Form:
The layout of the recording form should assist the analysis and/or computer entry of data. Excess transcription of data should be avoided; each time a number is written down the probability of introducing an error increases.
A useful format guideline is to keep the answers in an obvious column, usually at the extreme right side of the page. Also, to ease data entry it is useful to record the column number from the computer file next to the datum when using fixed field data entry.
In other cases, the question number can specify the column where the datum is to be located in the file. If a recording form contains a lot of data that will not be analyzed (at least initially), the data to be entered may be highlighted with special colored pens. Although recent advances in interactive computer programs reduce data entry problems, these suggestions will be useful nonetheless.
ADVERTISEMENTS:
Framing the Questions:
Asking questions correctly is as much an art as it is a science. Nonetheless, certain principles should be followed. Avoid asking leading questions; the question should begin with “Do you,” not “You do.” Make sure there is an obvious answer to each question, usually by providing a list of acceptable answers.
In general, open-ended questions should be avoided. For example, the question “Ventilation system?” is too vague. It could be interpreted as requiring a yes-no answer for the presence or absence of a ventilating system, a judgment of the system’s adequacy, a description of the fans, inlets, etc., or a host of other interpretations.
The terminology used in the question should be appropriate for the collaborators. For example, one probably should not ask a dairy farmer. Did the cow abort? But rather, Was the calf born dead? And How many months was the cow pregnant?
Besides providing more detailed information, these two questions avoid confusion about the meaning of the term abortion. Usually, animal owners may be questioned about clinical entities (such as scours or coughing) but not about entities classified on the basis of pathologic criteria (such as enteritis or pneumonia).
Some questions will have a set of mutually exclusive and exhaustive categories of answers (i.e., there is only one acceptable answer to a question and all possible answers are included). For example, in specifying “breed,” each animal must fit into one and only one category.
Thus all possible breeds should be specified, or the more common breeds might be listed with a final category of “other breed.” If more than one answer is acceptable (e.g., an Angus-Hereford cross), nonexclusive categories are required.
Other examples of nonexclusive categories relate to questions about ration content or the signs of disease. These are nonexclusive because the ration usually has more than one component, and there is usually more than one sign of disease. Although nonexclusive categories simplify the design of the recording form, they present problems in the analytic phase because of the potentially large number of combinations of answers.
A partial solution to these problems is that it may be sufficient to collect data only on the major ration component(s) or the major presenting sign(s). In other instances, a set of nonexclusive answers can be made exclusive (e.g., by asking is the animal coughing? or is the animal eating normally?). Another way of circumventing this is to list all possible combinations of categories (although this is usually not advisable because the list becomes too long).
In the latter instance one can assign a numeric code to each possible single answer in such a manner that the sum of all possible answers produces a unique number, representing each particular combination of individual factors. For example, if there are five possible breeds, they could be coded 1, 2, 4, 8, and 16.
Crossbred animals may be identified by using the sum of the numbers denoting the appropriate breeds. If an animal is a cross between the first and third breed listed, it would be coded as 5. The latter is more useful when cross-tabulation procedures will be used for analysis than when other methods such as linear regression are planned. Thus, each situation should be assessed individually.
When possible, it is desirable to record the answer as a continuous variable (e.g., the actual age, weight, titer). Grouping can be used if necessary later on. Most computer programs allow the specification of category limits, allowing a more powerful and flexible approach to the analysis than initially using categories such as 2 < 4, 4 < 6, and 6 < 8.
Unless it is desired to use a free-field format, when continuous variables are recorded they should be right justified. In a two column answer for age, a 9-year-old should be recorded as -9, or 09, not 9-, since the latter may be read as 90 years old. (A decimal placing could be specified, but this gives an upper limit of 9.9 years on the age if the field has only two columns.)
With numeric codes or answers, missing data must be differentiated from no answer or “unknown.” If there can be no answer, the column may be left blank, but if an answer should be given and is not available, a missing value code that will not be confused with valid answers should be used (e.g., 99 or -9 might be used to code for missing age values).
When a long list of possible answers is available, studies have shown a tendency for collaborators to select answers placed early in the list. Two solutions are offered. First, keep the list of answers short. Second, one may use two or three forms of the same questionnaire, and the order of the possible answers can be randomized within each form.
Editing the Data:
All recording forms should be edited manually before and/or during computer data entry or manual analyses. Initially, make sure that all required questions are answered and that no inappropriate answers are recorded. This procedure is often necessary when a hierarchy of questions is used.
For example, “if the answer is ‘yes,’ answer the specified sub-questions; if the answer is ‘no,’ proceed to the next major question.” (The question number may be specified.) Thus, manual editing should ensure that all appropriate sub-questions are answered, and it should also detect any inappropriate answers (e.g., the number of fans may have been recorded although the farmer had stated that none of them was operative).
In large surveys, computer assisted editing can enhance data validity. For example, programs can be devised to check that a cow name and number are valid, that the animal’s reported age is consistent with the recorded birth date, that the event specified is biologically feasible, etc. That is, if the cow is recorded pregnant, a diagnosis of metritis is not feasible unless the event “abortion” or “calving” was specified.
Computer editing can be expensive however, and judgment is required in the extent of its use. It should not be performed automatically in all cases. The setting in which data entry will occur and the likelihood of entering incorrect data should be considered prior to instituting computer assisted editing. In many cases no computerized editing is necessary; in others, it should be an essential component of data entry.
Pretesting the Survey:
Few people can design a perfect survey form in one attempt. Rather, iterative restructuring and rethinking of the questions and layout are required. A guideline about the time required to produce a useful survey is to make an initial careful estimate and then multiply by four or five.
Although framing the questions is an art, the evaluation of the survey during the pretest should be as scientifically rigorous as possible. Initially, one should check to see if the survey is too long, too detailed, or unclear. Then, some attempt should be made to establish the precision (reproducibility) of the survey.
This may be done by asking the same question twice during the same interview, or at a different interview. In a mail survey, attempts to elicit the same answer with two different but similar questions may provide evidence on reproducibility and validity of responses.
Note also that each question has its own sensitivity, specificity, and predictive value. Suppose the factor one wishes to obtain information on is the use of a specific vaccine. The sensitivity of the question, do you use the vaccine? Is the proportion of those who actually use the vaccine that answer affirmatively.
The specificity is the proportion of those who don’t use the vaccine that answer negatively. The predictive value, on the other hand, is the proportion of those who answer affirmatively who actually use the vaccine.
In order to assess the sensitivity and specificity of a question, an independent means of establishing the true state of nature is required. This may require investigative assessments (e.g., a search of the drug pail, inspection of the housing, or examining the feed bunks). One requires both care and tact in these assessments so as not to offend the collaborator.
It is useful to remember that all memory (including our own) is often faulty, more frequently by omission than by deliberate action. Although it is best to evaluate a survey keeping the collaborators blind to the evaluation, in many instances it may be necessary to inform the respondents of the pretest.
Analysis:
The details of the analysis will depend on the type of data collected as well as on the objectives of the survey. Nonetheless, one should not rush into detailed analyses before inspecting the data thoroughly and performing several simple summaries. This principle should be followed no matter how analytically adept the investigator.
When performing an analysis on a large data file, use only a portion of the data set initially. This will minimize costs if errors exist in the data set or in structuring the analytic program. Also at this stage, it is important to verify that the appropriate number of cases is present for each analysis or sub-analysis.
Final Thoughts:
Choose a time for data collection convenient for the collaborators. Sometimes this is not possible (e.g., if data relating to events in the period after arrival of calves in a feedlot are required, this is always a busy time). Be aware that the timing of the survey can affect the results.
For example, if dairy farmers from California were asked to rank disease in order of importance, calf losses would likely be ranked as important if the interview was in the winter or summer, but less important if the interview was in the early summer or fall. This is due to the seasonal nature of calf losses, not its overall importance.
To ensure consistency, decide who should answer the questions (i.e., should it be the owner, the person who feeds the animals, or the farm manager). Make sure all personnel involved know what is expected of them. Even if only two people administer the study, regular meetings to rehearse the data collection strategies, clear up problem areas, or to reinforce procedures will prove useful.
Finally, every effort should be made to obtain a high level of cooperation. Mail surveys often produce only a 40-50% response rate, whereas more than 80% cooperation is often obtained in personal interview surveys. Unfortunately, the results of a survey with a return rate of less than 70 or 80% are suspect.
The reason is that the collaborators are self-selected volunteers and could very well have different opinions, management styles, and levels of disease than those who refuse to collaborate.
Thus the general strategy is to select a practical number of individuals for the study and attempt to obtain a high rate of collaboration, rather than selecting two or three times as many potential collaborators and using the results of the 30-40% who choose to volunteer.
Strong associations are unlikely to be reversed if the cooperation rate is high; this may be shown by assuming the opposite association exists among all non-respondents. All associations are suspect if the cooperation rate is low; hence, it should be noted that it is the proportion of prospective collaborators who cooperate, not the absolute number of cooperators, that is important in terms of obtaining valid data.
An excellent critique of the methods used in national surveys of disease occurrence in animals is available. The use of questionnaire data in smaller scale field studies has also been described.
It is particularly interesting to note that observers from different sectors of the industry may rank diseases quite differently in terms of their importance. An example of the use of mail questionnaire data and its validation are provided by Hutchings and Martin (1983).
Analytic Observational Studies:
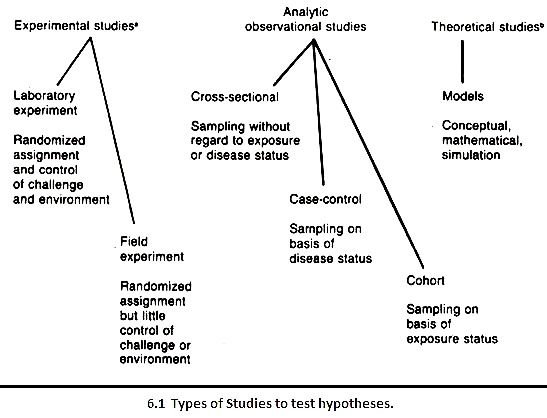
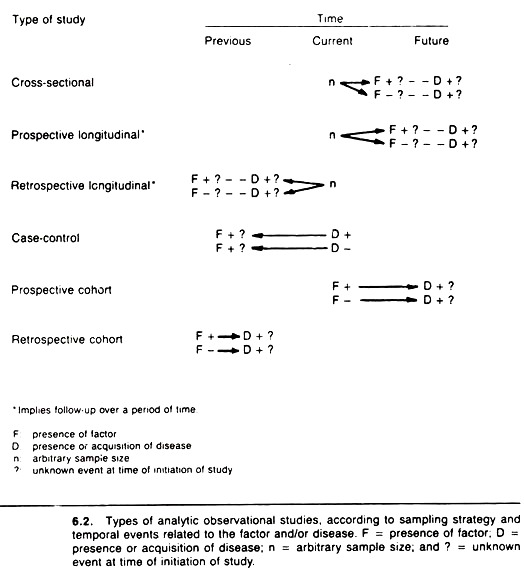
A general classification of the types of studies used to test hypotheses are shown in Figure 6.1. A more detailed description of analytic observational study methods is contained in Figure 6.2. The remainder of this article provides an outline of key items to be considered in the design and performance of each type of analytic observational study.
A chief advantage of analytic studies is that they are directed toward the species of concern in its natural environment. This greatly reduces the problems associated with extrapolating results from a particular study to the target population. It also allows the investigator to test a much broader range of hypotheses than would be possible under controlled experimental conditions.
However, it is often necessary to place restrictions on the source and selection of animals, for practical limitations and in order to make the groups to be contrasted comparable, although these restrictions may reduce any investigator’s ability to extrapolate results beyond the sample.
As a specific example, it is important to concisely and clearly describe the criteria used to define the status of the sampled units with respect to the independent and dependent variables. Although the specific criteria might lead to the exclusion of a few sampling units, without them there would be an increased probability of misclassification of the sampling units, and the validity of the results might be questioned.
For the observational studies discussed here, it is assumed that exposure and disease status are expressed as dichotomous or binary variables. Hence the chi-square test may be used to analyze the relationship between the putative causal factor and disease.
In veterinary medicine, since it is also extremely important to quantify the effect of disease on the level of production, many studies have disease status as the independent variable and level of production as the outcome or dependent variable. In this instance the outcome variable is continuous and the chi-square test is inappropriate (unless one divides production into categories).
If the impact of production level on disease occurrence was being investigated, level of production would be the exposure variable and disease occurrence the outcome of interest.
Here the independent variable is continuous, and again the chi- square test is inappropriate. Nonetheless, the general methodology of observational studies is easily transposed to the latter studies and the t-test is suitable .or the preliminary analysis of data from studies of this type.
Throughout this article the term sampling unit is used rather than individual, because in many epidemiologic studies a group of animals (e.g., a herd or flock) is the sampling unit rather than the individual.
Although this makes the grammar somewhat formal, the distinction between individuals versus aggregates as sampling units is very important to note. Many reports fail to make this distinction, rendering their results of little or no value.
Finally, a current biologic problem will be used to give substance to the discussion of study types. Suppose the objective is to study the association between the presence of urea-plasma in the vagina and infertility in dairy cows. (It is assumed that urea-plasma can cause infertility; the objective here is to determine the extent to which urea-plasma and infertility are associated under field conditions.)
Further assume that individual cows will be the sampling units, and that only 2 cows per farm are included in a study; this will prevent bias from farm-size related effects.
Prior to performing the study, the method(s) and timing of culturing cows for urea-plasma would need to be decided and standardized, and infertility would need to be defined in a workable, concise manner. The actual definitions and procedures could differ depending on the type of analytic study selected, but these differences will be ignored for illustrative purposes.
Cross-Sectional Study Design:
In the example, a cross-sectional study would require that a random sample of dairy cows be made (the sampling frame would need to be defined and a sampling method, probably multistage, selected), accompanied by an assessment of the current urea-plasma and infertility status of each cow.
Subsequent to this, comparisons could be made between the prevalence of existing infertility in cows currently infected with urea-plasma and the prevalence of infertility in non-infected cows.
Technically, cross-sectional studies provide a snapshot of events at a particular time. The point of time may range from an instant (“at the time of sampling”) to longer periods (such as “during the past year”), although all are treated as static, point-in-time events.
For purposes of causal interpretations, cross-sectional studies are best suited to studying permanent factors (such as breed, sex, or blood-type), since such factors cannot be altered by the passage of time or by the presence or absence of disease.
When the independent variable is a non-permanent factor (as in the urea-plasma example), one can never be sure whether the factor status is influencing disease occurrence or vice versa. That is, perhaps infertility allows urea-plasma to colonize and multiply in the vagina.
If random selection of sampling units is used and applied with adequate rigor, the key features relating to validity of cross-sectional study results are the accuracy of the data regarding the factor and disease status. Thus, criteria for classifying the sampling units as exposed and/or diseased should be clearly stated. In particular, one usually attempts to exclude potential false-positives when specifying these criteria.
That is, if misclassification of sampling units may occur, it is better to have a few exposed (diseased) units classified as non-exposed (non-diseased) than to have non-exposed (non-diseased) units classified as exposed (diseased). This makes the study results more conservative, but gives credence to any observed differences in rates of disease according to exposure status.
If the information about the factor and disease status may be biased by knowledge of the reason for the study, collaborators need not be informed of the major objective of the study.
For example, in a study to identify ration factors associated with the occurrence of left displaced abomasum in dairy cows, questions were asked relating to non-ration factors as well as the occurrence of diseases other than displaced abomasum.
It was hoped that this prevented the farmers from keying on the ration-displaced abomasum relationship and perhaps biasing the answers depending on their beliefs about the subject. Also, useful data to answer secondary objectives were obtained.
Sometimes the original sample is obtained by cross-sectional methods; then the sampling units are observed over a period of time, and changes in exposure and/or disease status are noted.
These studies are known as longitudinal studies, combining the benefits of cohort study methods (the ability to determine the factor status prior to disease occurrence and thus obtain incidence data) with the benefits of cross-sectional sampling (the knowledge of the frequency of the factor and/or disease in the source population).
Thus, the distinction between study types becomes blurred, particularly since longitudinal studies may be performed in a prospective or retrospective manner as described in Figure 6.2. Many studies reported in the veterinary literature are longitudinal in type, although most have used purposive or convenience samples rather than a true probability sample, reducing the ability to generalize beyond the sample data.
Questionnaire-based surveys, studies relating ancillary data to the results of immunologic, microbiologic, or toxicologic testing, and slaughterhouse surveys are common examples of cross-sectional studies.
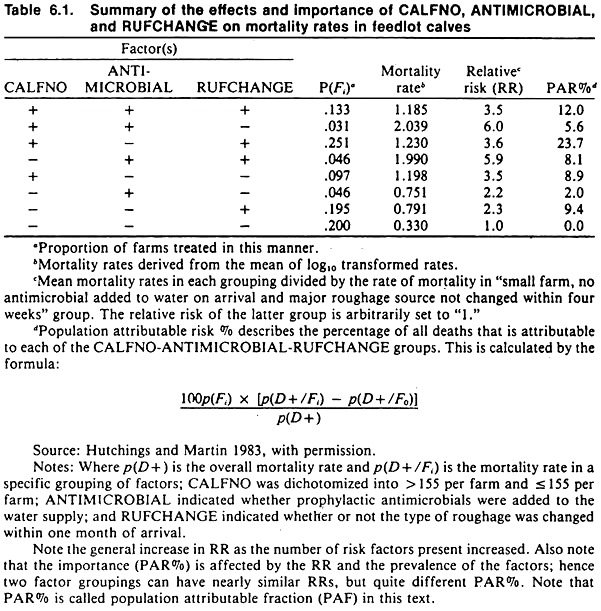
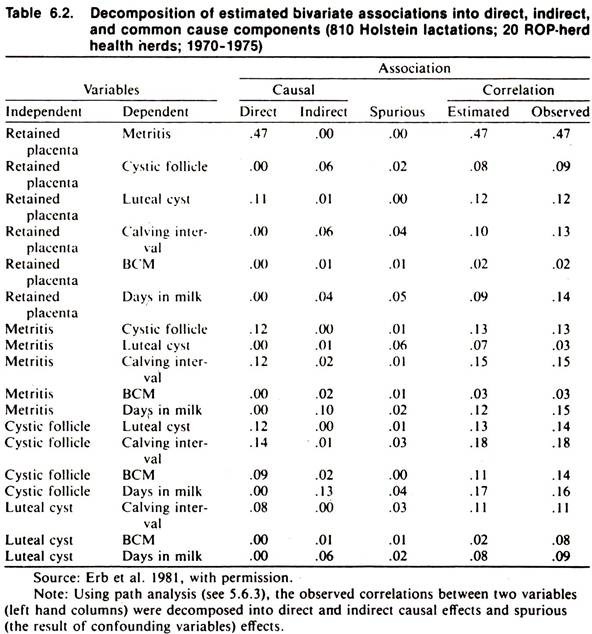
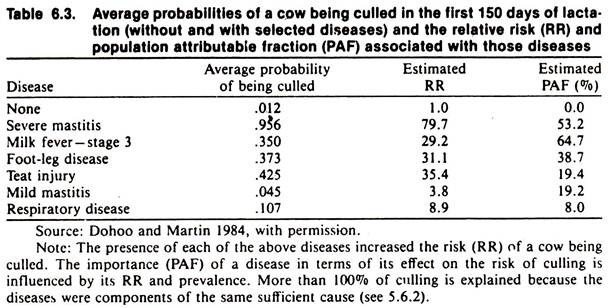
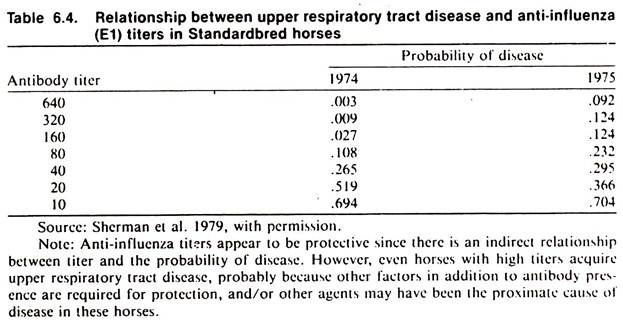
Examples of longitudinal studies include a California survey investigating pulmonary emphysema in cattle, a mail survey on factors associated with morbidity and mortality in feedlot calves (see Table 6.1), a retrospective study of diseases and productivity in dairy cattle (see Table 6.2), a prospective study of diseases and productivity in dairy cattle (see Table 6.3), and a study of respiratory disease in racing standard bred horses (see Table 6.4).
Case-Control Study Design:
In case-control studies, separate samples of units with (cases) and without (controls) the specified diseases are selected. Then the relative frequency of the factor in each of these groups is compared using the odds ratio.
Often all units with the disease and an equal number of controls are selected. In the present example, all infertile cows in a defined area might be used as cases, and an equal number of fertile cows selected as controls. (Matching for herd, age, and level of production might be used to increase the comparability of these groups.)
Each cow’s current urea-plasma infection status would be determined, and the proportion of infertile cows infected with urea-plasma would be compared to the proportion of fertile cows infected with urea-plasma. If the rate of infection were higher in infertile cows, this would support but not prove the hypothesis of urea-plasma producing infertility.
Since a number of biases can affect the results of case-control studies, key items are the criteria and methods used in the selection of cases and controls, the comparability of cases and controls, and an accurate unbiased history of exposure to the factor of interest.
Cohort Study Design:
In cohort studies, separate samples of exposed and unexposed units are selected. The groups are observed for a predetermined period, and the rate of disease in each is compared. In the urea-plasma example, the investigator might obtain an arbitrary number of urea-plasma infected cows and select a similar number of non-infected cows, perhaps matching for herd and age.
Any cows known to be infertile would be excluded at the start of the study. (In a practical situation, one might have to settle for excluding all cows with obvious reproductive tract abnormalities unrelated to urea-plasma, within 60 days of parturition.) All cows would be observed for a defined period of time (say 90 days after breeding commenced), and the subsequent rate of infertility in each group identified.
Although bias is less of a problem in cohort than case-control studies, key items to ensure validity are the criteria for and selection of the exposed and unexposed groups, equality of follow-up in both groups, and accurate diagnosis of disease.
Choosing the Analytic Study Method:
Often the choice of study method is influenced by the structure of the files or population to be sampled. For example, if the exposure and disease status of the units to be sampled are unknown, cross-sectional methods would be used. Case-control sampling may be a natural choice if records are filed or retrievable by diagnosis.
The choice of study type may also be influenced by the objective of the study and the amount of knowledge already known about the relationship between the factor(s) and disease(s) of interest.
Case-control studies allow initial screening and identification of multiple risk factors for a given disease, whereas cohort studies are suited to the screening and identification of multiple effects from a single cause. Cross-sectional and longitudinal studies allow the simultaneous study of many factors and diseases, and in addition provide direct estimates of the frequency of these events in the source population.
Finally, one must be aware of general advantages and disadvantages specific to each design. Cross-sectional studies usually only provide estimates of prevalence; thus one cannot differentiate factors associated with having disease from factors causing the disease.
Cross-sectional and longitudinal studies are not well suited to studying rare diseases, whereas case- control methods (requiring the smallest total sample size of any study type) are ideal in this situation.
Case-control studies are relatively easy and inexpensive to conduct, but suffer from many potential biases. Cohort and longitudinal studies provide direct estimates of incidence rates and the time sequence of events is well established. These studies are, however, the most difficult and expensive to conduct.
In summary, if the objective of the study is to screen for risk factors, use either cross-sectional or case-control studies, whereas if testing specific hypotheses use longitudinal or cohort methods. In some instances, field experiments are required as the ultimate evaluation of associations found in observational studies.
