In this article we will learn how to calculate the mortality rates of animal population.
Mortality rates describe the quantitative impact of death in an animal population. Two frequently used measures of mortality are the crude and cause-specific mortality rates.
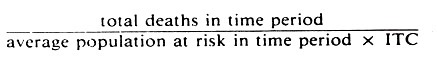
The formula for the crude mortality (true) rate is:
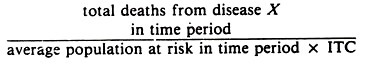
and the formula for the cause-specific mortality (true) rate is:
The probability (i.e., risk) of dying in a specified time period may be determined by restricting the denominator to those alive at the start of the time period and adjusting this number for any withdrawals, as was described for risk rates. All animals must be observed for the full time period, or until death or withdrawal occurs.
The risk of death in animals with a specific disease may be described using the case fatality rate.
The formula for a case fatality rate is:
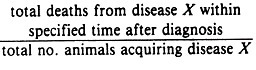
Case fatality rates are of greater value in acute than in chronic diseases and are used to describe the virulence of the agent and/or the severity of the disease. (See Table 3.1 for example calculations.)
An approximation that links case fatality rates (CFR), cause-specific mortality rates (CSMTR), and incidence rates (IR) is CFR = CSMTR/IR. Thus under certain assumptions, if any two of these rates are known, the third may be calculated.
Proportional Rates:
Sometimes, (e.g., when summarizing disease occurrence on one farm or in one clinic) an investigator divides the number of animals with a given disease by the total number of diseased animals. In other instances, the number of animals dying from a given disease is divided by the total number of deaths. These are called proportional morbidity or proportional mortality rates respectively.
ADVERTISEMENTS:
Although they have the form of a rate and often are mistakenly referred to as incidence or prevalence rates, the denominator is only a portion of the actual population at risk. Proportional rates may be affected by independent changes in the numerator, the denominator, or both. Hence proportional rates are potentially misleading, and their use is discouraged in favor of the morbidity or mortality rates described previously.
Variability of Rates:
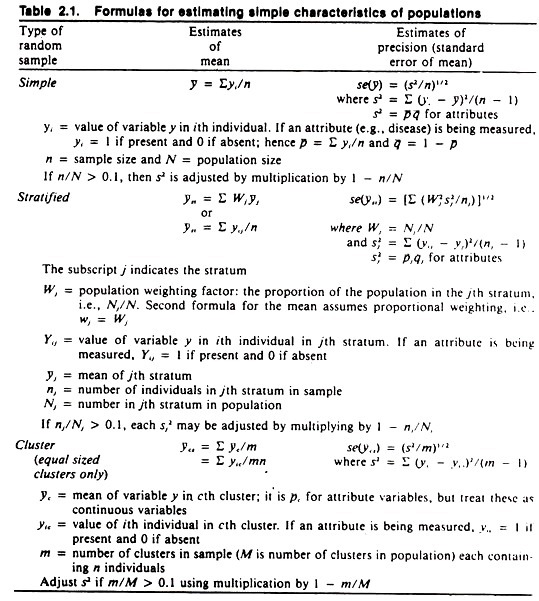
Risk rates and prevalence proportions are averages subject to variability from sampling error. In calculating this sampling error, the number of animals used to calculate the rate is regarded as if it was a random sample from a larger population. If repeated samples of the same number of individual’s n were selected, the calculated rate p would vary from sample to sample.
The extent of this variability is described by the standard error of the mean and is estimated from the sample to be:
![]()
A 95% confidence interval may be constructed using the upper and lower limits of the interval defined by p ± 1.96 x SE(p) (see Table 2.1). The interpretation to be placed on the confidence interval is that if many samples were selected and a confidence interval constructed for each, 95% would contain the true population rate. This approximation is quite good provided both n p̅ and n(1-p) are > 5.
Example Calculations:
Suppose that in a pen of 100 pigs, 30 develop pneumonia and 5 of these die during the first month on feed. If all pigs were free of pneumonia at the start of the feeding period, the true rate of pneumonia per month is 30/[(100 + 70)/2] = 0.35 or 35% (i.e., 35 per 100 pig months).
The probability of a pig developing pneumonia during the 1-month period (risk rate) is: 30/100 = 0.3 or 30%.
ADVERTISEMENTS:
If the above risk (0.3) remains constant during a 3-month feeding period, the probability of a pig developing pneumonia at least once during the 3-month period is:
![]()
This means that 66% of the pigs (or 100 x 0.66 = 66 pigs) would be expected to develop pneumonia in the 3-month period.
The true rate of mortality is 5/[(100 + 95)/2] = 0.051 per month, whereas the probability of a pig dying during the first month (risk rate) is 5/100 = 0.050. (Note that as the true rate decreases, it approximates the risk rate very closely.) If the probability of mortality remained constant for the 3-month feeding period, the probability of a pig dying in the 3-month period is 1 – (1 – 0.05)3/1 = 1 – 0.953 = 0.14. This means that 14% of the pigs would be expected to die during the 3-month feeding period.
The probability of a pig dying if it develops pneumonia is found by using the case fatality rate. In this example, the case fatality rate for pneumonia is 5/30 = 0.17 or 17%. (Note that since the only disease present is pneumonia, the above morbidity and mortality rates are cause-specific.)
If the 100 pigs were viewed as a sample of the feeder-pig population on this farm, one could construct confidence intervals for the average morbidity and mortality risk rates.
For the average morbidity risk rate, the standard error of p̅ (0.30) is SE(p̅) = (0.30 x 0.70/100)1/2 = 0.046 and hence the 95% confidence limits are 0.21-0.39 (21%-39%).
For the average mortality risk rate, the standard error of p̅ (0.05) is SE(p̅) = (0.05 x 0.95/100)1/2 = 0.022 and hence the 95% confidence limits are 0.007-0.093 (0.7%-9.3%).
If the 100 animals were obtained by formally sampling a defined population (a herd) with individual pigs being the sampling unit, and if the number studied was greater than 10% of the population, more precise estimates of the standard error may be obtained by adjustment using the finite population correction factor (see Table 2.1).
Hence, if there were only 500 pigs in the population, n/N = 0.2 and the correction factor for the standard error is (1 – 0.2) 1/2= 0.89. Thus the best estimate of the standard error of the morbidity rate is 0.046 X 0.89 = 0.04, and the best estimate of the standard error of the mortality rate is 0.022 x 0.89 = 0.02.
The resulting confidence intervals will be slightly narrower; a reflection that 20% of the population was sampled. The reader will now be aware that it is quite difficult to establish standard errors for true rates, hence no discussion of this topic will be presented. If standard errors are desired and the true rate is low (< 10%), one may use the same approach as demonstrated above for risk rates.