
Here is a term paper on ‘Animal Health Economics’. Find paragraphs, long and short term papers on ‘Animal Health Economics’ especially written for college and medical students.
Term Paper # 1. Introduction to Animal Health Economics:
The nature of the veterinary service provided to animal production, whether at the national or individual herd level, characteristically evolves with the stage of development of the community served. Thus, in the early part of this century, major emphasis was placed on the control of diseases that decimated animal populations over large geographic areas.
Decisions on whether to control these diseases could usually be made without the aid of formal economic appraisal, because generally the losses greatly exceeded control costs. As epidemic diseases of this latter type were brought under control, emphasis increasingly shifted to the individual property and to the treatment of endemic, clinically-recognizable disease.
While this latter approach met with a great deal of success, it suffered because it depended on the initial recognition of an abnormality by the farmer and was too heavily dependent on qualitative and subjective assessment.
ADVERTISEMENTS:
In recent years a number of trends (including an increase in the scale of operation, intensification of resource utilization, and the substitution of labor with other usually capital-intensive resources) have typified animal production, particularly in those areas where intensive agricultural methods are practiced.
These trends have resulted in those diseases or disease complexes that manifest themselves primarily through a decrease in productive efficiency and that in most cases are endemic becoming the most significant with respect to decreasing farm incomes. These disease conditions often have a complex multifactor etiology that is intimately related to the production system.
Also, since various intensities of control are often possible, it is necessary to determine the level of control that is economically optimal. In this regard, the feature of disease control that makes it such a valuable investment is that it generally increases the efficiency of the production process, and hence it is unlike most other goods and services the farmer may use that generally increase output without changing the nature of the process. This is one of the reasons why returns on funds invested in disease control are usually very high.
In a rapidly changing environment, decisions regarding animal health activities can rarely be made solely on biologic grounds. Rather, a dynamic integrated approach combining epidemiologic and economic analyses is required to determine the nature and scope of the health problem and the implications of intervention.
ADVERTISEMENTS:
As will be seen later, this is because economic appraisal is highly dependent upon the underlying technical appraisal. In general, economic analysis should be regarded as a tool providing additional information on which to base a decision, rather than a definitive method on which to base the final policy decision.
At the herd level, veterinarians are becoming increasingly aware that they work for farmers whose financial welfare is their interest. They are also realizing that whether their animals have a particular health problem (or have it at a particular level) is largely immaterial, unless it is economically advantageous to do something about it.
Exceptions would include zoonotic diseases or the control of disease for humane reasons, where the intensity of control may be greater than that which would be economically optimal. Thus, the choice between the available control techniques is a function of their economic and biologic efficiency. Also, because farmers’ participation is usually voluntary, they must be convinced that it is profitable to change their current management practices.
The above principles also apply at levels of organization beyond the farm, and most governments or agencies involved with disease control require that an economic analysis be completed so a rational choice can be made among alternatives competing for the same limited resources.
Term Paper # 2. Value of Economic Analysis:
ADVERTISEMENTS:
The majority of the early reports utilizing economic techniques concerned themselves primarily with estimating the cost of a particular disease to an individual producer or a nation. However, this approach is undesirable because it incorrectly suggests that this amount of money is completely recoverable.
In recent years the emphasis has moved to an evaluation of the economic benefits of control procedures. Not only is this approach more in accord with economic theory, but it also places a more positive orientation on the information by drawing attention to the benefits of action rather than the costs of inaction.
The principal purpose of economic analysis is to aid decision making regarding limited resource allocation. Hence, it provides a basis for making rational choices from among alternative preventive or control actions under various circumstances. Monetary values are used only as a common denominator for the value of particular resources in society.
Economists are aware of the limitations of this approach to valuation and have searched for a measure of satisfaction provided by a particular resource. The term “utility” is frequently used as a measure of this. A complete analysis should also indicate the confidence one can have in the monetary and/or utility ranking of the various strategies.
The objective of this article is to introduce some of the common methods that are used for the economic assessment of animal health activities and to place these in the context of the decision-making process, a schematic representation of which is presented in Figure 9.1.

The first step in solving any disease control problem is to clearly define it and the criteria or goal(s) that will be used to choose between alternative controls measures (including no action). One such criterion is economic efficiency. This implies that choices in health care should be made to result in the greatest average return or benefit from the resources available.
At the farm level it is frequently assumed that this point is where profit is maximized; however, many other factors (such as risk aversion) may contribute to the final decision.
The next steps in the decision-making process are data gathering and processing and the identification of alternative courses of action. To reach a decision as to which alternative to pursue, it is necessary to enumerate, measure, and value the benefits and costs for each alternative and to compare these.
ADVERTISEMENTS:
As indicated in Figure 9.1, this may include simulation or optimization studies. At this stage it may be necessary to consider and account for uncertainty in the results and the timing of cash flow. The economic evaluation can then be completed using the appropriate technique, the results integrated with other pertinent data, and a decision made.
The chosen alternative may then be implemented and monitored. The latter phase may again involve computer simulation studies. The actual method of economic appraisal used in any given situation will depend upon a number of factors such as the type of health problem under consideration and the scope of the control program.
Term Paper # 3. Partial Farm Budgeting:
In economic analyses, one must consider how variation in input to the animal production process influences the quantity and quality of output. If the intensity of control can be raised over a continuous spectrum so that a mathematical equation can be used to represent the data, this can be interpreted as a production function and the optimum level of control determined.
It can be shown with the aid of such a production function that farmers should continue to increase inputs until reaching the point where marginal (additional unit) costs (i.e., expenses) equal marginal (additional unit) benefits (i.e., revenues). However, in health related matters, sufficient information is rarely available to produce a full production function and hence calculate values from it.
Because of these difficulties, partial farm budget analysis may be used as it does not presuppose the estimation of a continuous function. It only requires the knowledge of two or more combinations of factors and their discrete input-output relationships.
While the partial farm budget technique can be applied to a number of different situations, a common application is to assess programs aimed at disease problems that can be assumed to occur on a farm with a high degree of certainty (e.g., bovine mastitis and internal parasitism).
The technique only considers those components of enterprise income and costs that are likely to be influenced by the proposed disease control procedure. In general, fixed costs (e.g., taxes) are largely ignored.
The technique therefore differs from whole farm budgeting in that the latter is usually reserved for the assessment of a change that will affect the total farm operation (such as the purchase of additional property) whereas the former is usually reserved for assessment of small changes that do not affect total farm management. A partial farm budget describes the economic consequences of a change in farm procedure.
To achieve this, the budget items are categorized as:
(1) Additional monetary returns received due to adoption of the proposed control procedure (e.g., increased yield of product at possibly higher prices);
(2) Foregone returns (e.g., reduced numbers of culled animals);
(3) Additional costs incurred due to the control procedure (e.g., expenditure for drugs and management procedures);
(4) Costs no longer incurred if the program is implemented (e.g., salvage treatment procedures).
The change in net return is then calculated by summing the returns and costs, calculated under headings 1 and 4 above and subtracting from that the amounts calculated under headings 2 and 3. This net return is an estimate of the additional profit that will accrue to the producer as a result of adopting the disease control procedure and is usually expressed in terms of some basic unit (e.g., per hectare).
The virtue of this procedure is that it permits a realistic appraisal to be made of the consequences of various actions without necessitating the keeping of complete financial records for the farm. One of the inherent difficulties with the technique is that arbitrary decisions must be made about which items to include.
The simplest solution is to include any item that may be affected, since if there is no effect it will not influence the outcome. Caution must be taken not to “double count”; that is, measure and include the same effect in two ways.
Another limitation is that it allows comparisons to be made between the strategies tested but does not necessarily provide optimum solutions. When possible, it is also advisable to determine how sensitive the conclusions from the analysis are to changes in product price and biological response.
An example of partial farm budgeting is presented in Table 9.1. The field trial from which these data were taken was designed to assess the economic benefits from two schemes, namely, traditional and critical strategies for helminthes control in weaned lambs.
The traditional scheme was based on a survey of local control procedures, whereas the critical scheme was based on strategic treatments applied in the late spring and early summer period and/was based on an objective appraisal.
The latter schemes were also compared to no strategic treatment and bi-weekly drenching.
The same information presented in the form of a partial budget and comparing the critical to the no strategic treatment schemes only would appear as:
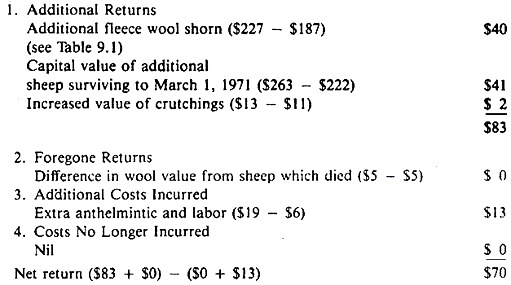
In examining data such as that presented in Table 9.1 a question arises as to whether net return or percentage return on marginal invested funds most accurately reflects the most profitable option. In general, if the farmer has unlimited funds available, the scheme with the highest net return is the most profitable and should be adopted (the critical scheme in Table 9.1).

If funds are limited, those available should be progressively invested in uses that yield the highest marginal return. Here, the percentage return on invested funds gives an imprecise assessment of marginal returns; however, it does facilitate comparisons between the investment alternatives. In the example cited, the critical scheme is the option of choice regardless of the availability of funds. Very often this is not the case.
Examination of the actual experimental results, from which these data were derived, revealed the factor that produced the main financial difference between the control strategies was the variation in mortality rate. The group of sheep receiving no strategic treatments suffered a 26% mortality rate compared to 12% in the critical scheme group.
The mortality rate in the no treatment group would need to be as low as 13% before the benefit from adopting the critical scheme would be reduced to zero (i.e., the break-even point). The individual farmers could assess how plausible this would be under their own particular situations when making their final decisions.
Term Paper # 4. Gross Margins Analysis:
In attempting to determine whether a farmer has benefited or will benefit from an improvement in herd health, the analysis may be carried out by means of a partial farm budget, particularly if only one health problem is under consideration, or by assessing the change in some economic index of performance with time.
One such index is the gross margin, usually expressed relative to some unit of production (e.g., gross margin per cow, per hectare, or per person). Gross margin analysis is the most practical method for assessing enterprise profitability, and it is widely used in farm management economics.
It can also be used for comparing the profitability of different enterprises on a farm and for estimating the effect of changes within the limits of fixed assets and other resources available to the farmer.
With regard to animal health activities, gross margin analysis perhaps finds its greatest application in assessing the effectiveness of integrated health management programs. The general format for calculating the gross margin of an animal related activity is presented in Table 9.2.

In gross margin analysis, all actual income from the enterprise in question is totalled, and all variable costs directly attributable to operating that enterprise are subtracted. The resultant figure is known as the “enterprise gross margin” or “profit before fixed costs”. Variable costs, as the name implies, vary as the size and/or level of an activity varies.
If cattle numbers are doubled, variable costs such as feed, husbandry, and marketing costs will also increase. (Purchases of animals can be either a variable or capital cost. Annual purchase of stock to maintain a flock or herd at a constant level is a variable cost, but purchase of stock to increase the permanent numbers is treated as a capital investment.)
As well as being directly associated with the level of intensity of each activity, many variable input costs determine the yield or level of output of the activity. With crops, the amount and kind of fertilizer, seed, or sprays influence crop yield. Similarly, with animal activities, the level and type of feed, drenches, and vaccines used may have a major effect on animal production.
Very little output would occur on farms unless money was spent on variable cost items. Fixed costs in the short run are incurred regardless of the level of output and include such things as taxes, insurance, and depreciation. Figure 9.2 illustrates in simplified linear form the relationship between fixed and variable costs and income.

Identifying the variable costs of an activity gives the farmer an idea of the size of the change in costs that would occur if one or more activities expand or contracts. For example, if the farmer decides to decrease the area of oats and increase the area of wheat, the variable costs will change, but the fixed costs are likely to remain about the same.
Knowing the likely variable costs and gross income, the farm operator is in a position to assess the merit of making a change in activities. Operating profit can be calculated by subtracting fixed costs from the total gross margin.
Gross margin analysis was used to assess the results of a 4-year controlled study designed to investigate the impact of a dairy herd health and management program on dairy farms. The analysis involved 59 program farms and 47 surveillance farms.
The gross margin consisted of three main parts: a livestock inventory, a section for dairy enterprise income (milk sales, livestock sales, and the value of milk or livestock transferred to other enterprises), and a cost section including supplementary feeds, livestock purchases, artificial insemination, and veterinary costs.
Other benefits or costs directly attributable to the study were also included for the program group of herds. On a mean whole-farm basis, the program resulted in an improvement (as measured by gross margin) of $23.58, $65.56, and $90.30 per hectare respectively, in the second, third, and fourth year when compared to year one.
Partial farm budgeting and gross margin analysis find their principal application in the assessment of control procedures for endemic diseases (such as bovine mastitis) and integrated health management programs. Difficulties arise when consideration is given to sporadic diseases (such as hypomagnesemia or entero-toxemia).
Diseases of this latter type must be viewed for planning purposes as not certain to occur within the immediate planning period; there is a strong chance or risk component. One technique that can be applied to decision making about disease control under such conditions of risk is the payoff table.
Term Paper # 5. Payoff Table:
The use of the payoff table entails the calculation of the payoff (returns minus costs) for each of the strategies under consideration, given that an outbreak of the disease does or does not occur.
An expected monetary value for each strategy is then calculated by multiplying each payoff by its probability, and summing these values over all possible outcomes for that strategy. The general form of the payoff table is presented in Table 9.3.

The assigned probability of disease occurrence is best based on objective data, but subjective estimates frequently must be used. The usual decision criterion is to choose the strategy with the highest expected monetary value.
However, veterinarians should remember that not-withstanding the above calculations, the final decision on what strategy to implement rests with the farmer, because the decision is made under risk of financial loss if incorrect.
A practical example of the use of the technique for decision making regarding control strategies for thromboembolic meningoencephalitis (TEME) is shown in Table 9.4. The calculations are based on a feedlot situation where: the price of cattle is $ 1.32/kg; average weight of cattle is 300 kg; number of cattle per pen is 350; number of pens per year is 67; and the probability of a pen becoming infected with TEME is 15%.

The alternatives investigated were:
(1) No action, assumed to result in a 3% mortality rate if TEME occurred;
(2) Vaccination of all cattle, assumed to give perfect protection at a cost of $2 per head; and
(3) Mass treatment of all cattle at a cost of $114 per pen if a case occurs. In the last case an overall mortality rate of 1% is assumed.
The dollar values presented in Table 9.4 are gross returns under each circumstance minus any vaccine or treatment costs. In this case and given the above assumptions, strategy 3 resulted in the highest expected monetary value and hence would be the option of choice.
The same data can be presented in the form of a decision tree (Fig. 9.3) in which choices (decision nodes) are represented by squares, probability events by circles, and outcomes are given at the right of the tree. Tree diagrams can become much more complex in nature as other dimensions (such as time) are added to the problem. Another example of the use of decision analysis relates to the treatment of ovarian cysts in dairy cattle.

The importance of uncertainty as a factor influencing decisions about disease control has been underestimated. The environment in which practical decisions are made is usually uncertain and involves complex relationships among many factors. In fact, farmers usually tend not to invest large sums of money purely on the basis of expected return when they are uncertain of the outcome.
There are a number of methods for dealing with uncertainty, one of which is to conduct a sensitivity analysis. In such an analysis, the sensitivity of the outcome to variation over the likely range of the items used in the calculations (e.g., costs, prices, probabilities, etc.) is assessed.
The decision maker can then integrate these outcomes with one’s own personal aversion to risk and subjective assessment of the likelihood of various combinations (such as extremes of price or mortality) in making a final decision.
Another dimension that can be used when making decisions under uncertainty is the concept of utility. If the decision maker has no risk preference (indifferent to risk), the expected monetary value approach and the expected utility approach are the same. (Fig. 9.4a)
However, if the decision maker has preference or aversion to risk as illustrated in (Figure 9.4b), maximization of expected utility may be the appropriate approach. The approach is based on the fact that monetary amounts may not provide a measure of the relative value a person attaches to different sized gains or losses.

The risk-aversion curve illustrated in Figure 9.4b implies that its owner values an extra $1000 at two-thirds the value of an extra $4000; whereas the individual with no risk preference (Fig. 9.4a) values a $4000 gain at 4 times a $1000 gain. The latter case is not characteristic of many people, especially when large sums of money (gains or losses) are involved.
As an example, suppose one has a choice between two costless alternatives:
(1) Tossing a fair coin for $100,000 if a head appears or $0 if a tail appears; or
(2) A certain gift of $50,000. Which alternative would you choose? (Note that both have the same expected monetary value of $50,000.)
Most people would accept the sure alternative; the value they attach to the 50% chance of $100,000 is more than offset by the 50% chance of receiving $0. People differ in their utility because of things such as their past experience or psychological makeup. As circumstances change over time (e.g., if a person becomes rich playing the stock market) the shape of their utility curve may also change.
In the expected utility approach, utility values are derived from the utility function. The latter values are then multiplied by the probability values to calculate the expected utility value, as opposed to the expected monetary value.
The same approach can be used without the consideration of economic values. In this approach the decision maker assigns a subjective assessment to the value of each possible outcome —for example, death (0), spontaneous resolution (100), and various other outcomes (e.g., surgery with serious complications, scaled appropriately between these, extremes).
Term Paper # 6. Cost-Effectiveness Analysis:
A technique that overcomes some of the difficulties involved in putting a dollar figure on all the benefits of a disease control program is cost- effectiveness analysis.
This approach is appropriate where the benefits are difficult to quantify (e.g., the benefits to the human population of rabies control), when production losses under each control strategy are equal, or when the activity has been defined as essential for one reason or another.
In such instances the requirement is for a method of analysis that determines how the desired result can be achieved at minimum (discounted) cost. In fact, the procedure is the cost part of a benefit-cost analysis carried out on its own. The question of whether the benefit is sufficiently worthwhile to justify the expenditure may, for example, be strictly a political one.
Thus, the benefit-cost group of techniques available range from benefit-cost analysis at one end of the spectrum, which deals only with financially quantifiable benefits and costs, through to cost-effectiveness analysis at the other end, where all benefits are considered unquantifiable, equal, or are otherwise ignored, and only the costs are calculated.
In most cases the actual technique will be a hybrid of the two, in which monetary and nonmonetary benefits are quantified and the nature of unquantifiable benefits for each strategy is stated.