
The below mentioned article provides zoology notes on colorimeter.
Description:
The Colorimeter 03581 is designed to determine the concentration of a solution by analyzing its colour intensity. The Colorimeter measures the amount of light transmitted through the sample solution at a user selectable wavelength. Light from the LED passes through a cuvette that contains a sample solution. A light-sensitive photocell at the other end of the light path detects amount of transmitted light.
The sensitivity of the Colorimeter’s response is maximized by selecting a light colour to be transmitted thought he test sample. By using the front panel arrow keys the following wavelengths can be selected: 635 nm (red), 565 nm (green), 470 nm (blue) and 430 nm (violet). Generally a colour which is complementary to that of the test sample should be used.
ADVERTISEMENTS:
In most chemical tests the intensity of the colour reaction is directly proportional to the concentration of the substance being tested – the more intense colour, the higher the concentration. Or in terms of the Colorimeter, the less light transmitted to the photocell (the most light absorbed by the sample), the higher concentration.
A quantitative reading for the concentration of a substance is based on Beer’s law curve and can be found by making up a series of solutions of known concentrations of the chemical under study, and plotting a graph of absorbance against concentration. By reading off the absorbance of the specimen substance, a value for its concentration is known.
The sensor is equipped with a BT plug and can be connected to the following CMA interfaces:
CLab, CoachLab II/II+ and ULAB. Furthermore the sensor can be used with Texas Instruments CBL™, CBL2™ and VernierLabPro.
ADVERTISEMENTS:
Sensor specifications:
The Colorimeter has a memory chip (EEPROM) with information about the sensor. Through a simple protocol (I2C) the sensor transfers its data: name, quantity, unit and calibration to the interface1.
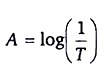
The relation between Transmittance (T) and Absorbance (A):
The amount of light that passes through a solution is known as transmittance. Transmittance T can be expressed as the ratio the intensity of the transmitted light I, and the initial intensity of the light beam I0:
![]()
The reciprocal of transmittance of the sample various logarithmically (base ten) with the product of three factors:ϵ, the moral absorptivity of the solution; b, the cell or cuvette width; and C, the molar concentration:
![]()
In addition, many experiments designed to use a Colorimeter require a related measurement, absorbance. At first glance, the relationship between transmittance and absorbance would appear to be a simple inverse relationship; that is, as the amount of light transmitted by a solution increases, the amount of light absorbed might be expected to decrease proportionally.
But the true relationship between these two is inverse and logarithmic:
Combining the two previous equations, the following expression is obtained:
A = ԑ * b * c
In effect, this formula implies that the light absorbed by a solution depends on the absorbing ability of the solute, the distance traveled by the light through the solution, and the concentration of the solution. For a given solution contained in a cuvette with a constant cell width, one can assume ԑ and b to be constant.
This leads to the equation:
ADVERTISEMENTS:
A = k * C where fc is a proportionality constant
This equation shows absorbance to be related directly to concentration and represents a mathematical statement of Beer’s law. In many chemical and biological experiments this law is assumed for making calibration line for determining concentration.
To obtain a Beer’s law curve, several solutions of known concentration are prepared and their absorbance values are determined using a Colorimeter. A graph of absorbance vs. concentration is then plotted. A solution of unknown concentration is placed in the Colorimeter and its absorbance is measured. When the absorbance of this solution is interpolated on the Beer’s law curve, its concentration is determined.
Note:
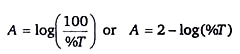
Transmittance can be also expressed as percent transmittance or %T. Since T = %T / 100, the formula describing the relationship between absorbance and transmittance can be rewritten as
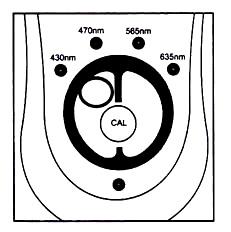
Wavelength selection:
By using the wavelength selection arrows on the top of the Calormimeter you can select one of four LED light wavelengths: violet (430 nm), blue (470 nm), green (565 nm) and red (635 nm). There are several ways you can decide which of the four wavelengths to use.
Method 1:
Look at the colour of the selection. Remember that the colour of a solution is the colour of light that passes through it. You probably want to use a different colour of light that will be absorbed, rather than transmitted; for example, with a blue copper (II) sulfate (CuSO4) solution, use the red LED (635 nm).
Method 2:
Another easy method is to place a cuvette containing the solution in quation in the Colorimeter and check to see which of the wavelengths yields the highest absorbance.
Method 3:
Directions for most colorimetry experiments express a recommended wavelength. Use the wavelength closest in value to the recommended wavelength. Even if the LED wavelength is somewhat different, a Beer’s law curve can usually be obtained at most any wavelength in the vicinity of the recommended wavelength.
Using cuvettes with the Colorimeter:
The Colorimeter is designed to use polystrene 1 cm x 1 cm cuvettes (standard disposable cuvettes). Two opposite sides of the cuvette are ribbed and are not intended to transmit the light from the LED. The two smooth surfaces are intended to transmit light.
It is important to position the cuvette correctly in the Colorimeter, with a smooth side facing the arrow at the back of the slot, and with the ribbed edges facing left and right. The light travels from the LED at the top, through the cuvette, to the detector below the slot.
Just like most spectrophotometer sample tubes, individual plastic cuvettes vary slightly in the amount of light they absorb. You may choose to ignore these differences. For most lab exercises, this variation will not have a noticeable effect on experimental results.
For best results, variation in light absorbed by individual cuvettes can be controlled either by using the same cuvette for all trails of a particular experiment or by matching a set of cuvettes. The easiest and most reliable is the first method.
If a student is going to use five trials for a Beer’s law experiment, the five standard solutions can be transferred to the same cuvette for each trial. This requires that the cuvette must be clean and dry after each trial or rinsed several times with the solution that will be added to it.
As an alternative you may choose to match cuvettres. Matched cuvettes are a set of cuvettes that all absorb light (when empty) at appromately the same level. To match a set of cuvettes use clean, dry cuvettes, put a reference mark on one of the clean sides of the cuvettes so it is always oriented the same way in the cuvette slot.
Place each cuvette in the Colorimeter and record absorbance values for each. When you are finished group cuvaettes according to the similar absorbance values. The total volume of a cuvette is 4.1 ml. Fill the cuvette for every measurement with 2.2 to 3.5 ml. As a reminder to students mark the level with a water-proof marker on one of the ribbed sides of each cuvette.
Caps are supplied for the original 15 cuvettes. A cuvette may or may not have a cap on it when placed in the Colorimeter. The purpose of the cap is to prevent evaporation of solvent when a experiment is run over a period of several days.
Examples of experiments:
The Colorimeter can be used in experiments such as:
Application of Beer’s law:
Crystal violet – Diluted solutions of crystal violet yield a good Beer’s law curve using the green LED (565 nm). A stock solution 8 x 10⁻⁵ M crystal violet is prepared by adding 65.3 mg of solid crystal violet to enough water to yields 2 litres of solution.
Copper sulphate – Standard solutions of 0.1 M, 0.2 M, 0.3 M and 0.4 M CuSO4 will yield a good Beer’s law curve at 635 nm (red LED). Or prepare a stock solution by adding 10 g of NH4NO3 to 10 ml 0.1 M CuSO4 and 90 mL 0.2 M NH3 (forms Cu(NH3 )42+ complexion) and dilute to obtain standard solutions.
Determination of the rate reaction of crystal violet:
Add 10 ml of 8 x 10⁻⁵ M crystal violet solution to 5.0 ml of 0.10 M NaOH and fill with water to 100 ml. The de-colouring of the solution takes from 15 to 20 minutes.
Calibration:
The output of the Colorimeter is linear with respect to the transmittance. Before collecting data the zero-point calibration for the selected wavelength should be performed. Let the system stabilize at the desired wavelength for 5 minutes. One of the four green wavelength indicator lights is turned on when the Colorimeter is powered.
To perform zero-point calibration:
1. Press the <or> button on the Colorimeter to select the correct wavelength setting for your experiment (430 nm, 470 nm, 565 nm, or 635 nm).
2. Open the Colorimeter lid.
3. Insert a cuvette, usually filled with distilled water, for your blank measurement (100% transmittance or 0 absorbance).
Important:
Line up one of the clear side of the cuvette with the arrow at the top of the cuvette slot (see figure).
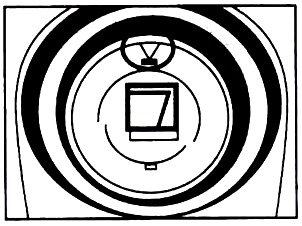
4. Close the Colorimeter lid.
5. Next, press the CAL button to begin the calibration process. Release the CAL button when the red LED begins to flash. The calibration is flashing and the absorbance will be 0.000 or 0.001. The unit is now ready to collect data.
The sensor EEPROM memory and the standard sensor library of the Coach program supply the absorbance-voltage calibration (the Colorimeter works like an absorbance meter with water as solvent).
The Calirmeter produces as output voltage, which varies in a linear way with transmittance according to the formula:
Vout = 0.035 *%T
The relationship between the absorbance and output voltage is:
A = 2- log(%T)
= 2-log (28.571*Vout)
= 0.544068 -log(Vout)
The name of the Colorimeter in the sensor library of the Coach program is Colorimeter (4 colours) (0.3581i) (CMA) (0.1).
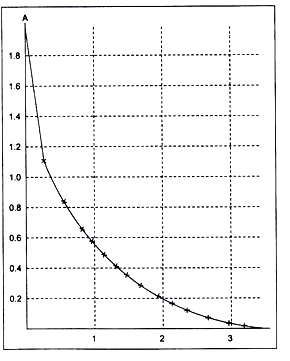
Figure 2.
Default calibration graph of the Colorimeter (used in the standard Coash sensor library and in the sensor memory).
A = 0.544068-log Vout
Absorbance and Transmittance ranges for the Colorimeter:
For best results our laboratory testing of the Colorimeter indicates that transmittance or absorbance values should fall with these ranges:
Transmittance: 0.10 – 0.90
Absorbance: 0.05 – 1.0
A part from the limitations of the transmittance range of the Colorimeter there is a measurement error in the concentration (absorbance) measurement, which strongly depends on the error in the tramittance (dT% in figure 12.2).

To get sufficiently reliable results calibration solutions should be used which lie in the flat part of the curve dT% = 1% (i.e. 1% accuracy of the transmission). We have found that Beer’s law experiment results begin to lost their linearity at absorbance values above 1.0 (transmittance values less than 0.10). If you have a solution that transmits such a low level of light, consider diluting the solution so that it falls within this range.